$ES #ES #trading setup #Daily #micro #Elliott Wave #trading strategy
Yesterday in a macro update I posted that Daily chart of ES-mini futures:
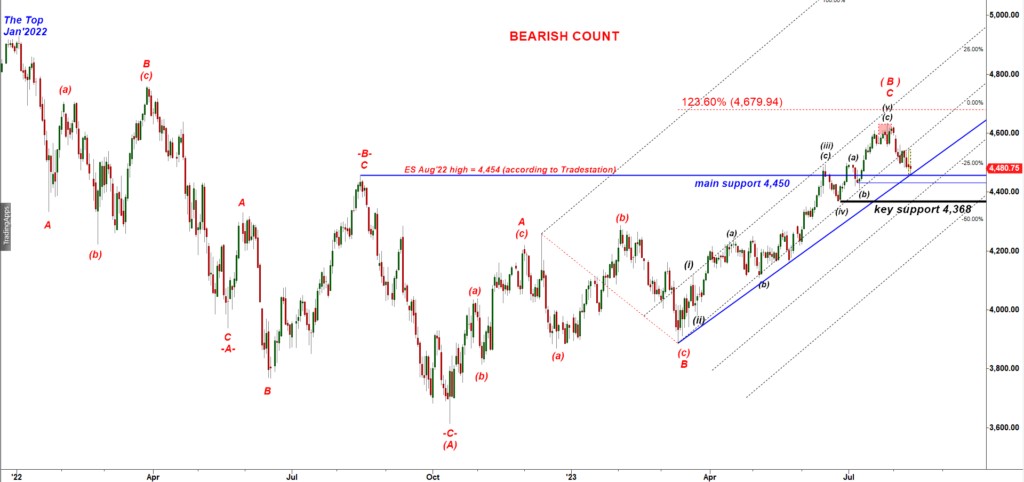
The rule is “upon completion of a five wave up structure the low made by a pullback in a wave (iv) down works both as a magnet for the first pullback and a strong support”.
Therefore, the macro target 1 for the first (a)-(b)-(c) move down is 4,368, the low made by a micro wave (iv) down on June 26th, 2023.
If we get an a-b-c- down structure testing that support that would keep possibility for another rally after that pullback. If, in contrast, we will see extension of that decline without large pullbacks that would be a strong argument in favor of the macro bearish scenario where ES-mini completed the corrective wave (B) up in June 2023.
Let’s zoom in to a 240 min chart of ES-mini:
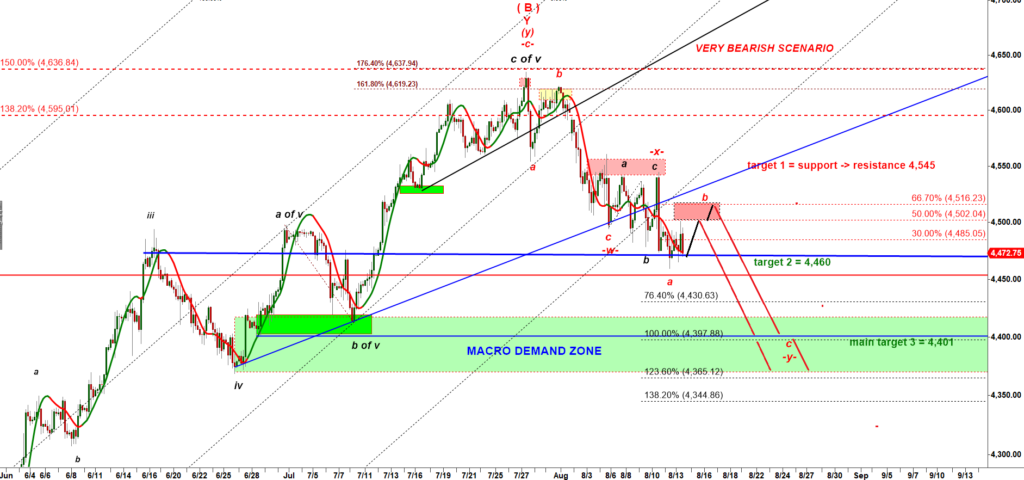
On that chart you can see the Green Demand zone with it strongest part located in between of 4,400 and 4,365.
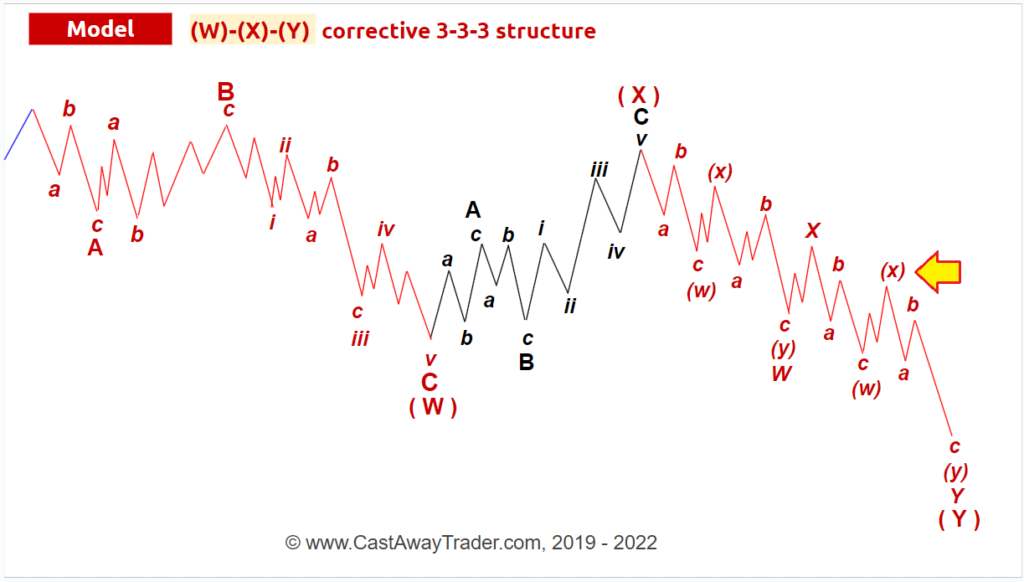
This is a possible current position of ES-mini on a corrective (w)-(x)-(y) down fractal:
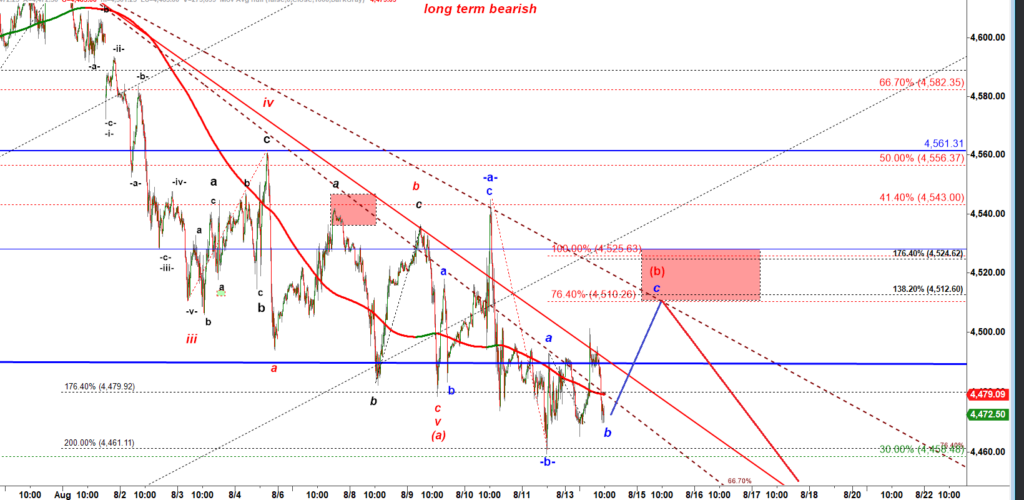
Based on that macro analysis we can see that potential for a bounce may be limited by the lower edge of the Red Box on a micro 15 min chart below:
In conclusion:
If bulls fail to break over the Red Box on a 15 min chart shown above that shallow consolidation can be followed by a very strong decline to 4,400, the strongest drop in the whole down structure off the July high.