$ES #ES-mini #trading setup #Elliott Wave #a-b-c up bounce
I keep watching two macro scenarios on a weekly chart of S&P cash index:
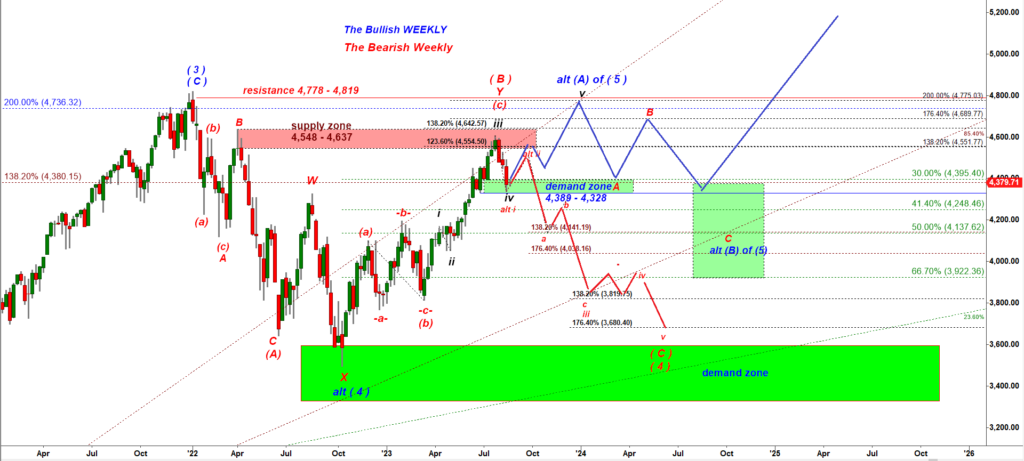
The main difference between the bullish blue path and the bearish red path is how far this move up off the upper demand zone can go. My primary scenario is the red bearish one. I expect the rally off the upper green box to fail. SPX cash index: If this move up stops at 50% – 66.7% retracement (4,472 – 4,517) of the decline off the July top that would be the critical juncture where bears will be able to turn S&P down and start a new larger leg down.
Note those levels for ES-mini futures will be slightly different (4,494 – 4,541):
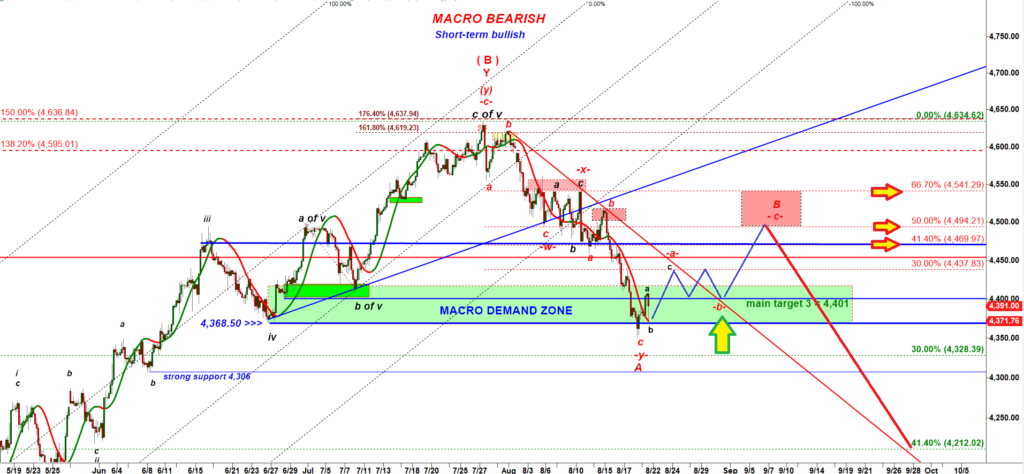
As you can see on that 240 min chart I expect this move up to be structured as an -a-b-c- up structure where both legs, waves -a- and -c- may be shaped as micro a-b-c’s. The first resistance is the declining red trend line. Most likely bulls will NOT be able to break over that level at the first attempt. Ideally after this resistance is tested we should get a flat a-b-c down consolidation that can test that broken resistance from above turning it into a support.
That would be a long setup to ride another leg up in a wave -c- (see the green arrow).
BONUS: Short-term path:
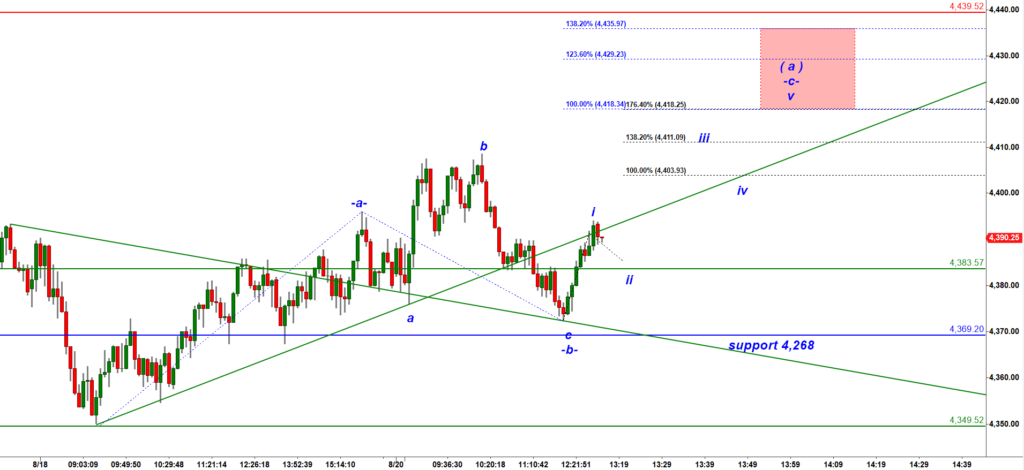
Bulls have a setup to produce one more leg up targeting 4,418+.