$S&P: Applying 1999 – 2000 Fractal to Guide Us in 2024

  • CastAwayTrader
  • January 15, 2024
<<< Back to All Updates
<<< Macro Updates

$SPX #Yearly Opening Range #Yearly #Macro #Weekend

Let me start from explanation what the Yearly Opening Range is.

You may have read my explanation about a Month Opening Range strategy here.

The very same principle can be applied on a higher timeframe:

S&P Daily chart, 1972

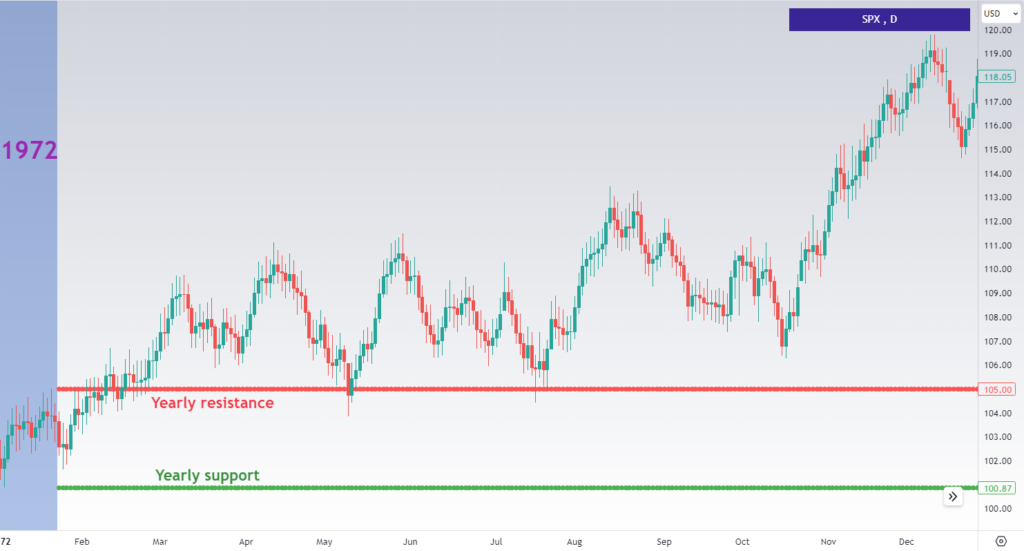
On the chart above you can see the Yearly Opening Range formed during the first three trading weeks of a year (that three week period has the blue background).

The red line is the Yearly Resistance, the highest price recorded during the first three weeks of a year.

The green line is the Yearly Support, the lowest price recorded during the first three weeks of a year.

During first three weeks of a year the market sets boundaries for the following 49 trading weeks.

Once the range has been set, swing traders and investors may wait for the market to break out of the range and consider that breakout or breakdown as confirmation of the prevailing trend direction.

On the S&P chart for 1972 (shown above) you can see that S&P broke over the Yearly Resistance but then came back down to that broken-resistance-turned-support line three times, in March, may and in July. Moreover, bears tried to push S&P under that red line again in October.

In each of those four instances bears failed. And each failed attempt to break under the Monthly Resistance was followed by a multi week rally.

So, we can conclude that the textbook LONG swing trading setup is a break over the Yearly Resistance followed by re-test of the broken-resistance-turned-support from above.

By the way, note that 1972 was the election year in the USA. And this 2024 year is an election year in the USA.

‼️This week starting on Jan 15, 2024 will be the third trading week of 2024 year. This week we will complete the Year opening range and finalize the Yearly Resistance.

So far for S&P the Yearly Support is 4,682.11.

So far for S&P the Yearly Resistance for 2023 is 4,802.40. But bulls can push S&P higher this week and by doing that they would change the Yearly Resistance.

We will know the final numbers on OPEX Friday close.

Interestingly, 1999 was a pre-election year and look how well it resembles the 2023, the pre-election year:

S&P Daily chart, 1999

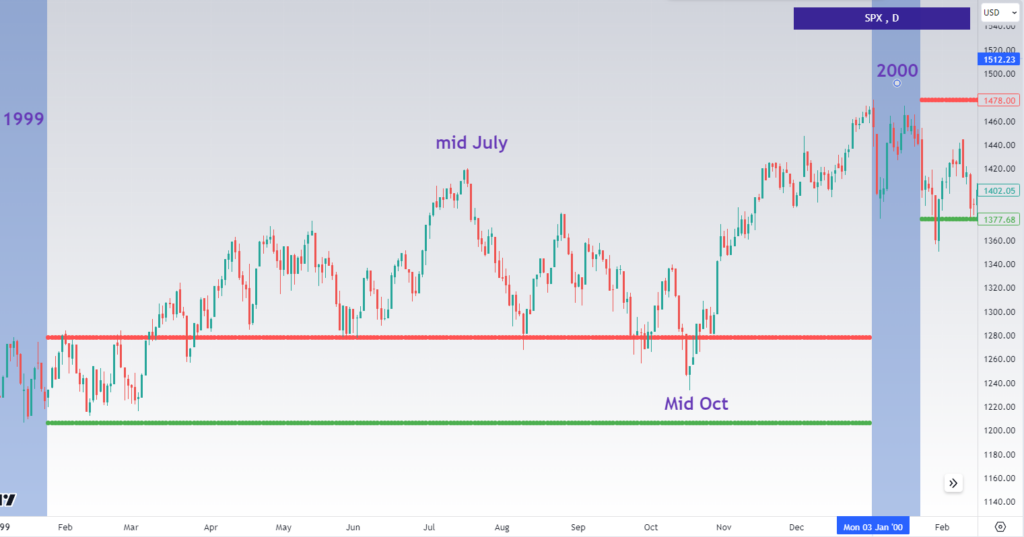
In 1999 S&P topped in July, made a low in mid October and then rallied strongly right into the year end. Exactly like it did in 2023!

If we acknowledge that 1999 and 2023 were similar, we may assume that 2024 would resemble 2000:

S&P Daily chart, 2000

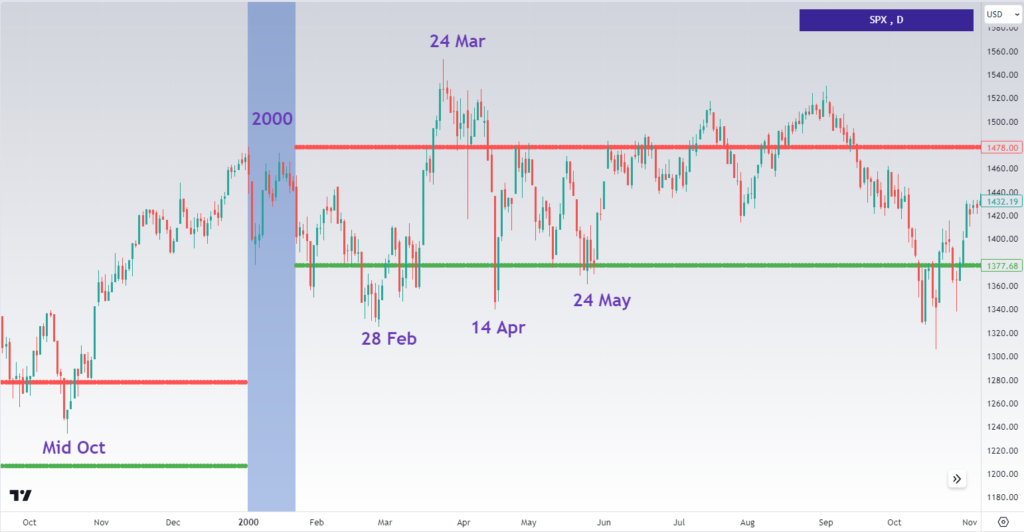
You can see that in 2000 S&P made a double top on the second Friday of January (like S&P did the very last week!) and started to slide down on the third week of January. Under that fractal we should see weakness in S&P during the upcoming week and bears testing the Yearly Support 2024 = 4,682.

I can show you a couple of more election years where S&P showed weakness immediately after January OPEX Friday.

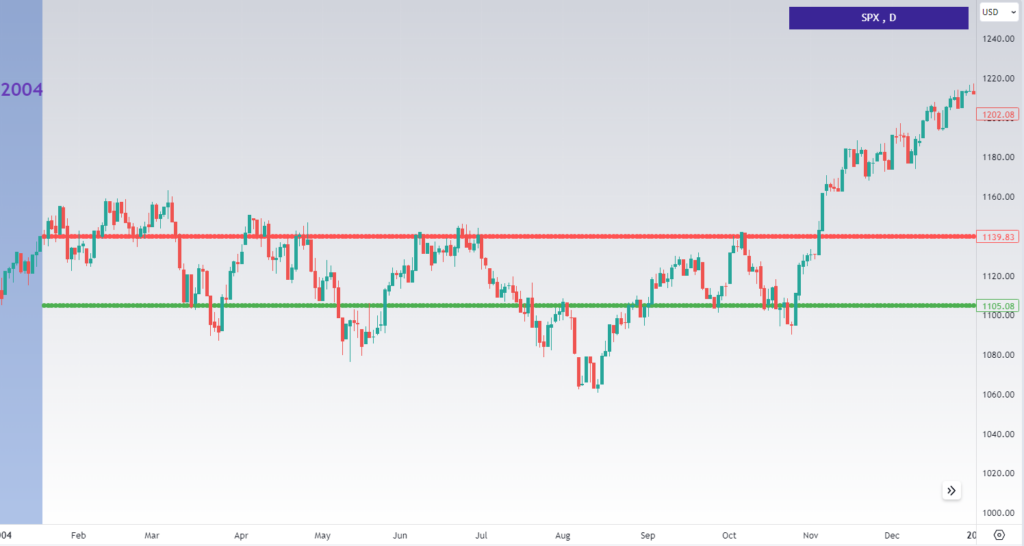
For instance, 2004 was another election year when bulls could not make any progress until November:

S&P Daily chart, 2000

1992 was another election year that followed a very strong rally in December 1991:

S&P Daily chart, 1992

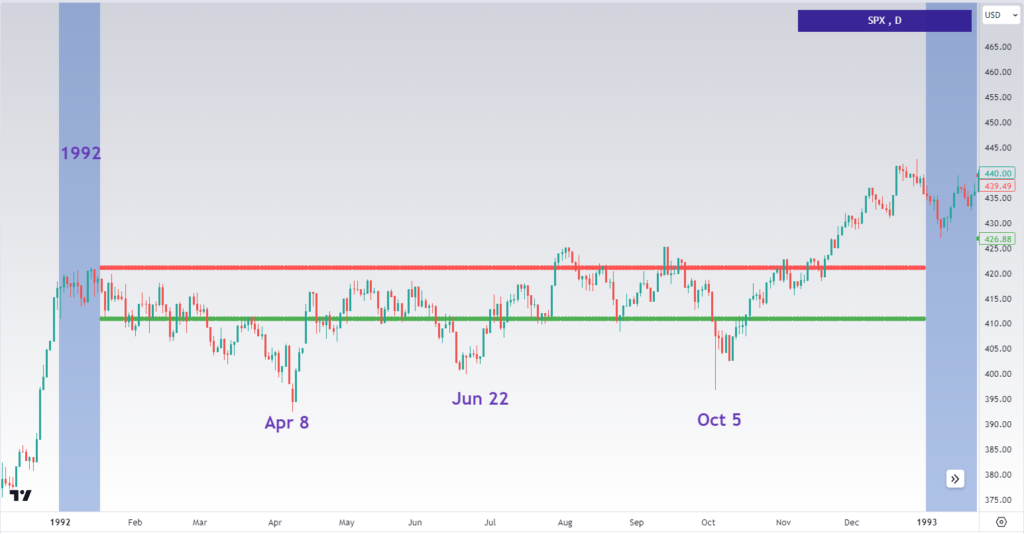
And yet again we see that the market was in a whipsaw mode until October 1992…

Subscribe to Free Updates

Get Unlimited Access

PrevPrevious$ES: Has This Wave -b- Up Topped?
Next$NQ: We Can Get a Pullback in the 1Q 2024Next

More To Explore

$ES: Bears Failed to Break the Monthly Support

$ES #Month Opening Range Yesterday, I anticipated a classic “pump-and-dump” scenario following the FOMC announcement. However, that move didn’t materialize.

CastAwayTrader May 8, 2025

$ES: Be Prepared for FOMC-Driven “Pump-and-Dump” Setup?

#FOMC #ES #corrective (a)-(b)-(c) The ES-mini bounced off the early April low in a three-wave corrective structure. So far, wave

CastAwayTrader May 7, 2025

Important Disclaimer

CastAway Trader LLC, the publisher of this web-site and videos is not registered as an investment adviser nor a broker/dealer with either the U. S. Securities & Exchange Commission or any state securities regulatory authority. Users of the website www.castawaytrader.com and viewers of the videos are advised that all information presented on the website is solely for informational purposes, is not intended to be used as a personalized investment recommendation, and is not attuned to any specific portfolio or to any user’s particular investment needs or objectives.

Trading stocks, options, or futures carries a high level of risk, and may not be suitable for all investors. Before deciding to trade, you should carefully consider your objectives, financial situation, needs and level of experience. CastAway Trader LLC provides general overview of trading methods that does not take into account your objectives, financial situation or needs. The content of this website must not be construed as personal advice. All trading setups and/or trades presented in the web site and/or trading chat room by CastAway Trader an/or by other members of the chat should be considered hypothetical for educational purposes only and should not be expected to be replicated in a live trading account.

An investor could potentially lose all or more than the initial investment. You should not speculate with capital that you cannot afford to lose. Only risk capital should be used for trading and only those with sufficient risk capital should consider trading. Risk capital is money that can be lost without jeopardizing ones’ financial security or life style.

You should be aware of all the risks associated with trading. You should seek advice from an independent financial advisor.

Any information posted on this web site is not to be construed as an offer to sell or the solicitation of an offer to buy, nor is it to be construed as a recommendation to buy, hold or sell (short or otherwise) any security. All users of the website must determine for themselves what specific investments to make or not make and are urged to consult with their own independent financial advisors with respect to any investment decision. The reader bears responsibility for his/her own investment research and decisions, should seek the advice of a qualified securities professional before making any investment, and investigate and fully understand any and all risks before investing. All opinions, analyses and information posted on the website are based on sources believed to be reliable and written in good faith, but should be independently verified, and no representation or warranty of any kind, express or implied, is made, including but not limited to any representation or warranty concerning accuracy, completeness, correctness, timeliness or appropriateness. In addition, CastAwayTrader LLC and its officers and employees undertake no responsibility to notify such opinions, analyses or information or to keep such opinions, analyses or information current. Also be aware that the owners, officers and employees of the web site www.castawaytrader.com may have long or short positions in securities that may be discussed on the website, Premium Trading Chat room and/or in the videos posted by CastAway Trader LLC.

Past results are not indicative of future profits.

Subscribe to Free Updates

Get Unlimited Access