$ES #ES-mini #Elliott Waves #trading setup
Last week ES declined to a well defined support level 5,721-5,711 (the resistance-turned-support):
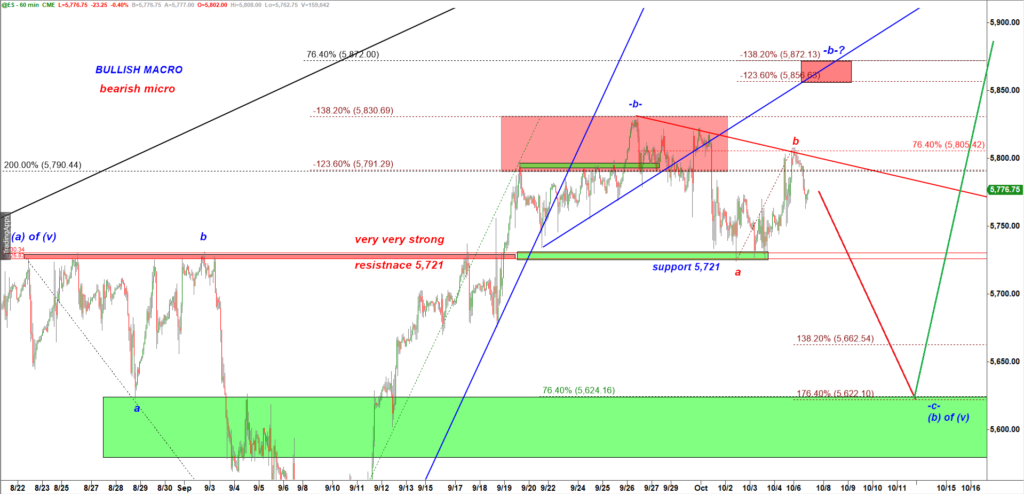
ES-mini 60 min chart
Failure to break under that support was followed by an overlapping (sign of weakness) move up that stopped right at the critically important 76.4% retracement fib (5,805).
The big picture is that I expect ES to decline in October.
That can happen right from here, break under 5,721-5,711 then slide down to the next lower Green Demand zone and find a strong support at 5,624.
I can see two micro paths to 5,624.
Straightforward immediate bearish scenario.
The decline may happen right from here (see the red line on the chart above).
To trigger that bearish scenario bears need to finally break 5,721 support to open the door for extension down to 5,624.
2. Alternatively, bulls can break over 5,805 resistance and extend the really up to 5,872.
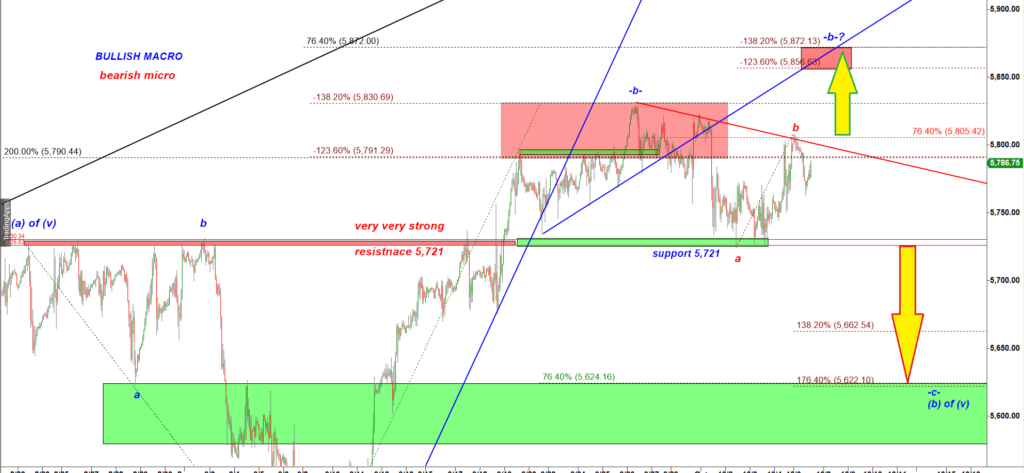
ES-mini 60 min chart
On Thursday the market completed the Monthly Opening Range:
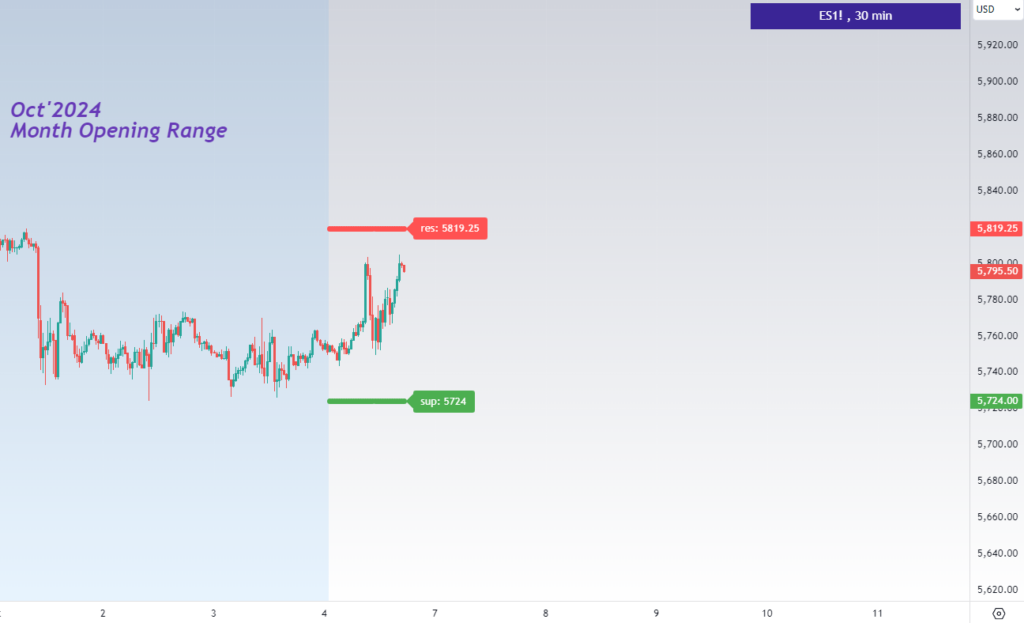
The Month Opening Range for ES futures is 5,819 (Monthly Resistance) and 5,724 (Monthly Support). That is a well established range that has been respected for the previous two weeks.
Break out of the Monthly Opening Range should trigger a trending move for at least next 10 days until the mid month.