$ES #ES-mini #trading setup #Elliott Wave
The primary wave count is bearish. That wave count is based on an important assumption that ES has made a lasting top:
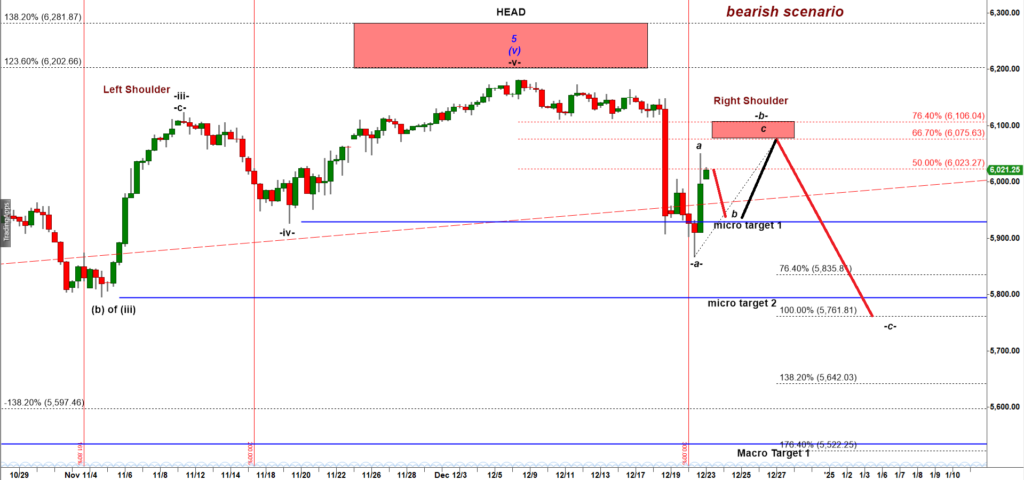
ES-mini 8 hour chart
Under that wave count ES may leak down to 5,920sh and then produce another rally up to the Red Box or start a new leg down towards the micro target 2 = 5,800.
The main problem with the primary bearish count is that sharp accelerated drop. This is not how new impulsive/trending moves start. But this is exactly how a subwave (c) down of a corrective (a) down, (b) up, (c) down structure (see the bullish wave count below):
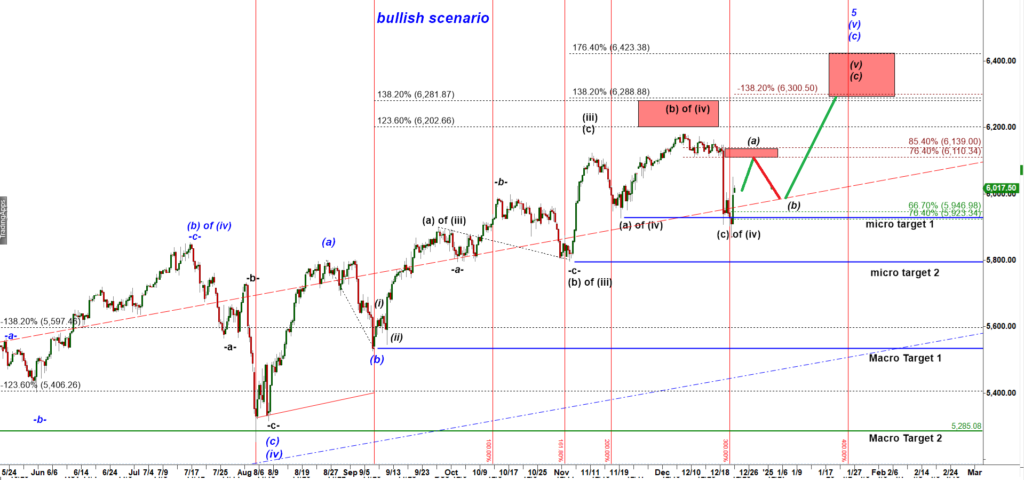
ES-mini 8 hour chart
Under that alternative bullish wave count bulls have to keep pushing ES-mini higher up to 6,100 in a subwave (a) of wave (v) up.
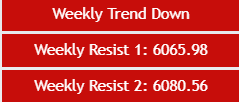
The most important resistance levels for the new week are:
Micro wise ES opened over the Daily resistance turning the daily trend down:
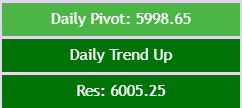
That 6,005 – 5,998.50 is the key support for bulls to defend tonight and on Monday morning.
Let’s update the chart with applied Monthly Opening Range indicator:
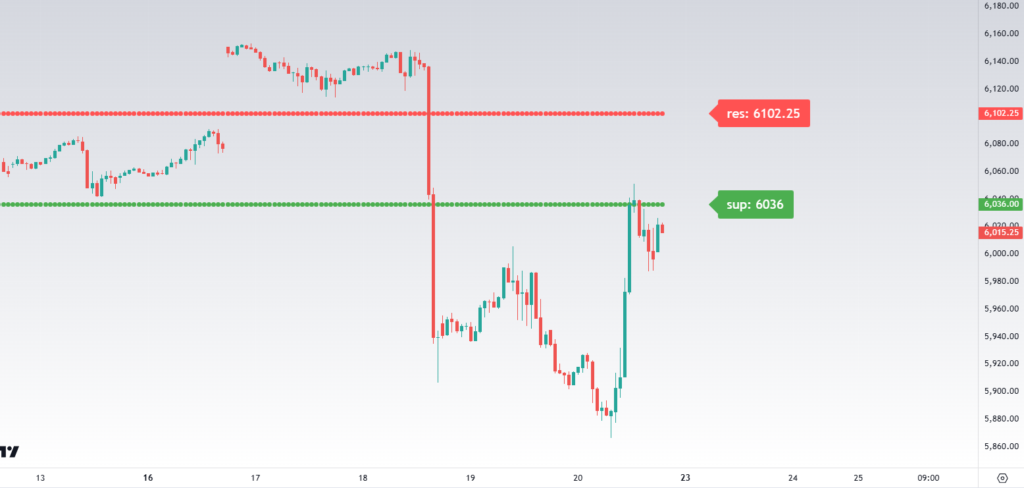
ES-mini 60 min chart
Note where the Friday rally stopped. Right at the broken green Monthly Support 6,036, the key resistance now. So far it looks bearish, a break under a monthly support was followed by a corrective rally back up to the broken-support-turned-resistance.
Note, that the bullish scenario can get triggered by a move over 6,036. Such a breakout would open the door for a move up towards the Monthly Resistance 6,102.