#ES $ES #Elliott Wave
Yesterday morning I got you prepared for one more push lower to test and undershoot the key milestone 5,525 level of support:
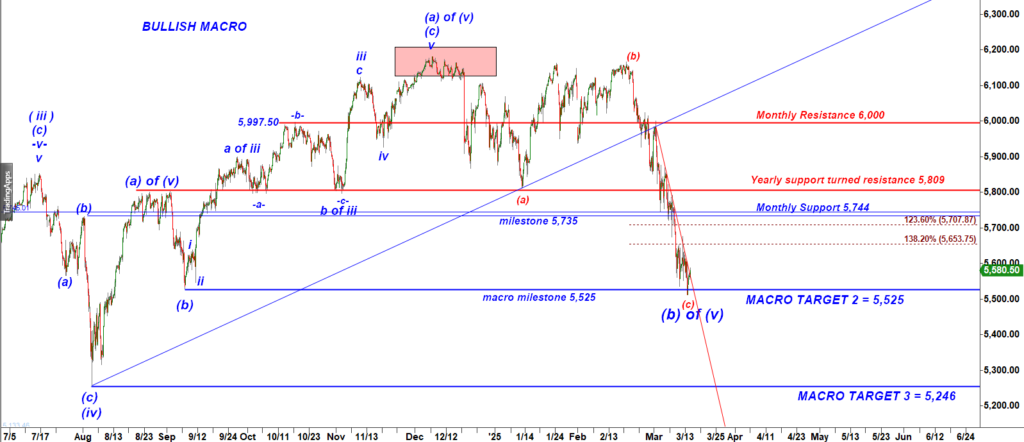
ES-mini 240 min chart
This is an excerpt from Thursday morning report:
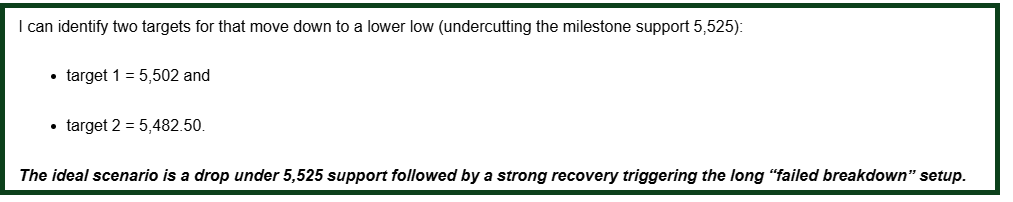
ES made the low at 5,509.25, pretty close to the expected target 1.
Then, as we expected, the most reliable “failed breakdown” setup played out nicely once again: undershot of 5,525 level was followed by a bullish reversal.
Bulls can consider the a-b-c up off the Thu low as a promising micro wave i up. In that case we may go through a painful deep pullback in a wave ii down:
Es-mini 13,500 tick bar chart
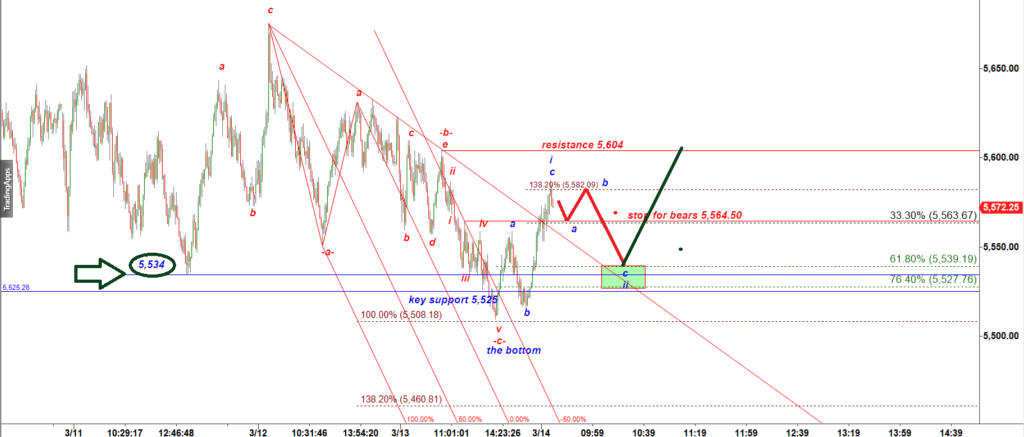
THE MORNING UPDATE // 10:28 AM EST
We can see ES consolidating after the first move up off the potential bottom. As long as bulls hold it over 5,550 I would expect another leg up:
This is my Cycle Trader indicator in action:
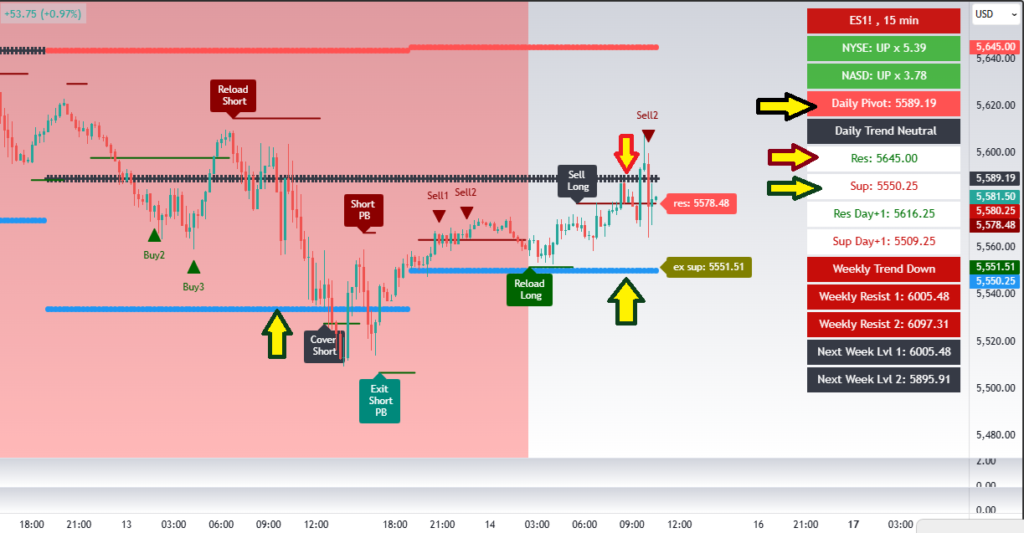
ES-mini 15 min chart
Note that the move up got stopped by the black daily pivot 5,589.
Break over that level would most likely be followed by a rally to the red Daily resistance 5,645.
Read more about that indicator here: https://www.castawaytrader.com/cycle-trader-indicator/
AFTERNOON UPDATE // 3-23 PM EST
In the morning update I noted that a break over 5,589 would most likely be followed by a 50 pts rally to 5,645:
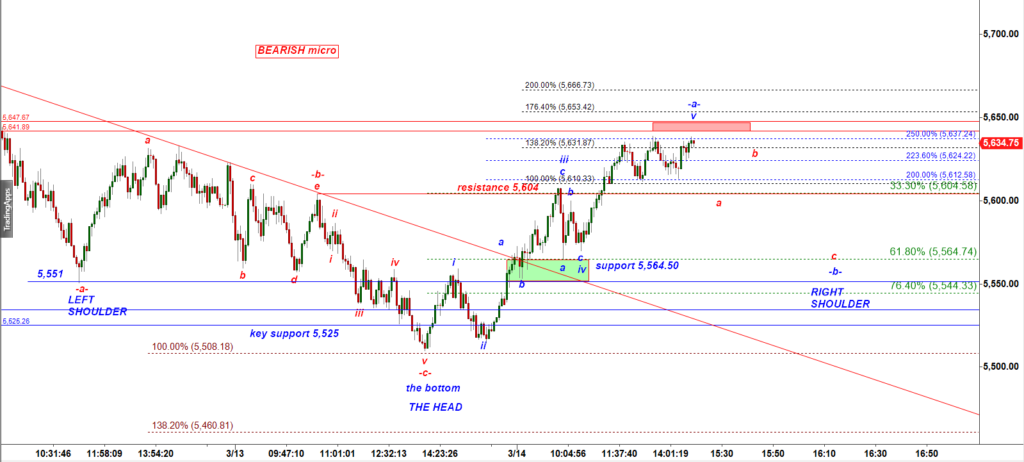
ES-mini tick bar chart
The rally has reached the 5,640 – 5,650 is a resistance zone.
It is possible to count the move up off the low as a completed five wave up rally that is supposed to be followed by a corrective a-b-c down pullback. Note that 5,633 can be considered a neckline of a bullish reversal Inverse Head and Shoulders pattern.
To complete that IHS pattern bears need to push ES back down to 5,565 to draw the Right Shoulder. That would be a wave -b- down.