$ES #ES-mini #Elliott Wave
The bullish scenario considers the low made on March 13th as a bottom of a corrective (a) down, (b) up, (c) down corrective pullback that made a higher low:

ES-mini 240 min chart
That (a) down, (b) up, (c) down pllback built a base for bulls to start a new impulsive rally.
Impulsive rally means that bulls will ride five waves. The problem is the wave (i) up in majority of cases is the weakest part of the rally. Its the weakest because bears who kept pushing price down in the course of the wave (c) down refuse to believe a new rally has started. They consider the move up off the last low as yet another opportunity to go short.
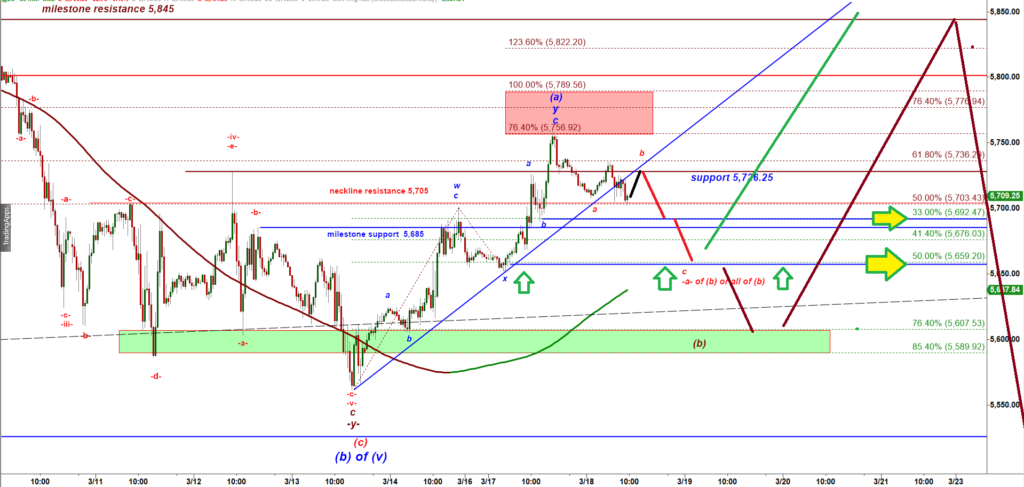
This is what bears see:

ES-mini 240 min chart
If we get a flat -a-b-c- up bounce off the low made on March 13th.
There are several strong resistance levels waiting for bulls over the high made on Monday:
(1) Broken Monthly support-turned-resistance = 5,796, and
(2) 5,836 , a 41.4% retracement fib, and
(3) 5,862, a broken Yearly Support, and
(4) 5,893, a 50% retracement of the recent leg down.
Until bulls break over all four levels of resistance we will not be able to discard that bearish scenario.
If we look at a micro structure of the move up off the low that does not have good news for bulls.
ES-mini 30 min chart
The problem is the rally followed a corrective -w-x-y- up structure, not the impulsive five wave up structure.
So the corrective micro structure and the weakness of the first move up (the rally stopped without testing even the resistance 1 = 5,796) makes us consider the bearish scenario.
In any case, I would expect bears to produce more pressure. I would expect bears to test 5,692 and then 5,659 ( a 50% retracement of the -w-x-y- up rally).
And that 5,659 would be the critical level of support.  If bulls manage to stop bleeding at that level and start a new rally, that would be a strong argument in favor of the bullish scenario that allows bulls to start a rally in a wave (c) of ( i ) up to 5,845.
 Break under support 5,659 can be followed by a strong drop down to 5,607 – 5,590 green Demand zone.
My Cycle Trader indicator for TradingView calculates buying and selling pressure separately for NYSE and Nasadaq.
Yesterday I warned subscribers of my Premium chat room that the rally smelled bad:
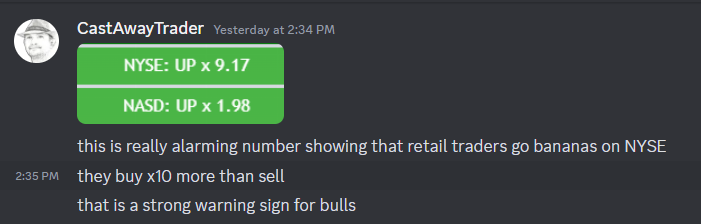
The rally on Friday and Monday was led by retail traders. And that is always a bad sign. But when retail traders bet their farms on a bullish reversal ahead of big funds that makes them an easy pray for a shake out drop!
MORNING UPDATE AT 10-28 AM est
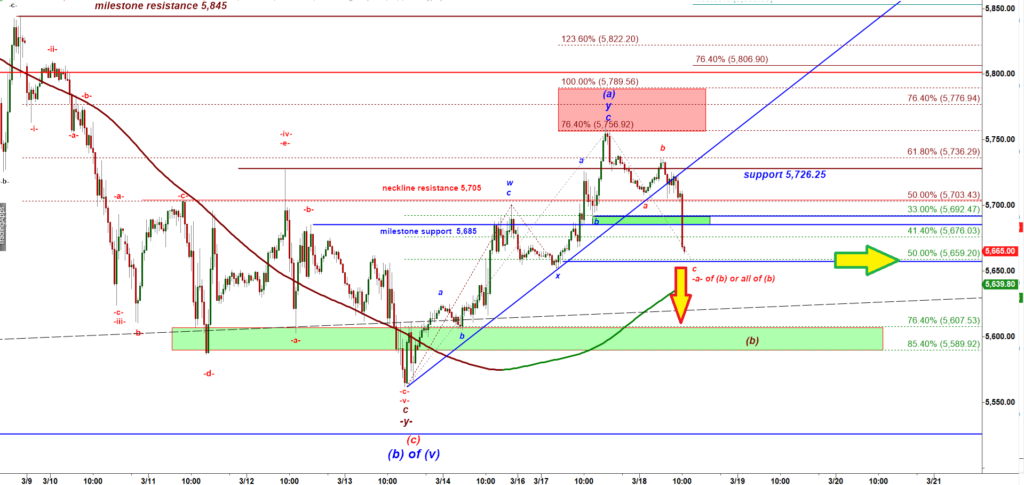
ES-mini 30 min chart
- …And that 5,659 would be the critical level of support. If bulls manage to stop bleeding at that level and start a new rally, that would be a strong argument in favor of the bullish scenario that allows bulls to start a rally in a wave (c) of ( i ) up to 5,845
- Break under support 5,659 can be followed by a strong drop down to 5,607 – 5,590 green Demand zone.
 Putin will be talking to Trump about the cease fire in Ukraine around 11:00 AM EST.
- Any good outcome of that call and announcement of a cease fire can spark another rally.