$NQ #NQ
The broader outlook for NQ remains bearish.
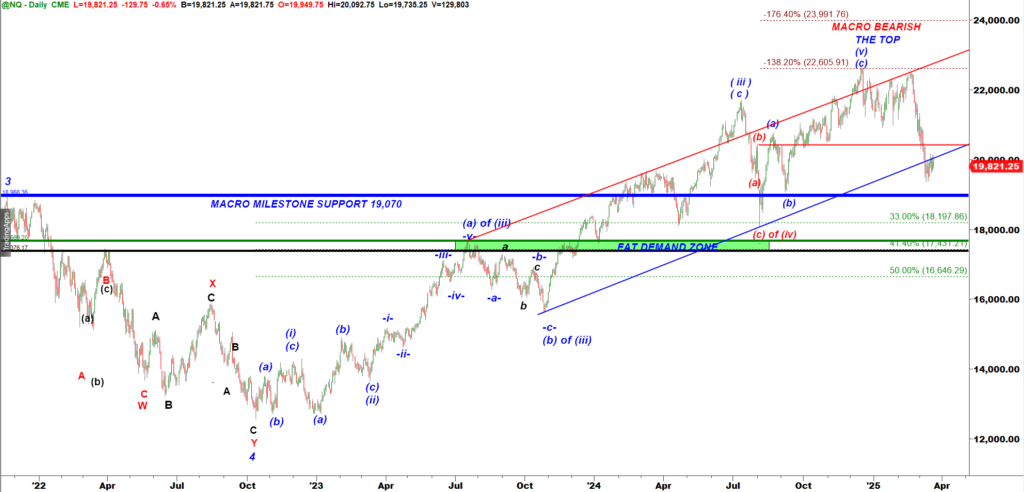
We can consider the rally that began in October 2022 as completed.
NQ Daily chart
After the completion of a five-wave impulsive structure, we typically expect a corrective A down, B up, C down pattern to follow.
- A wave A down generally retraces 33.3% or 41.4% of the preceding rally.
- The 33.3% retracement level is at 19,312.
- So far, the March 25 drop found support at 19,346, which is very close to that level.
NQ Daily chart
Additionally, take note of the thick blue line at 19,070 on the chart. This is a major support level for two key reasons:
- It was the low made by subwave b down in September 2024.
- It was also the peak of wave 3 up in November 2021—which marked the pre-COVID high.
This level holds significant importance.

NQ-mini 30 min chart
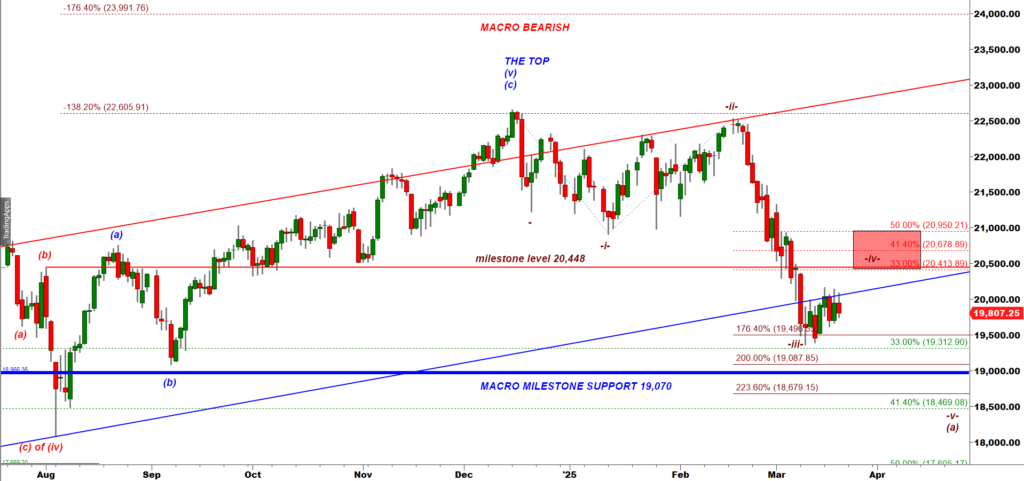
Bears may argue that the initial wave (a) down could extend lower, reaching the 41.4% retracement level at 18,469, which would undershoot the key milestone support at 19,070.
They may also contend that NQ is currently forming a corrective wave iv up, which could potentially test the red milestone resistance at 20,448—a 33.3% retracement of the preceding decline.
The micro bullish scenario remains valid as long as bulls hold NQ above the subwave -b- low at 19,609. But this rally to the Red Target zone may complete a corrective wave -iv- up and be followed by another drop down to 19,000.