$ES #ES-mini #ElliottWave
On Tuesday I shared a bullish path to a new all time high:
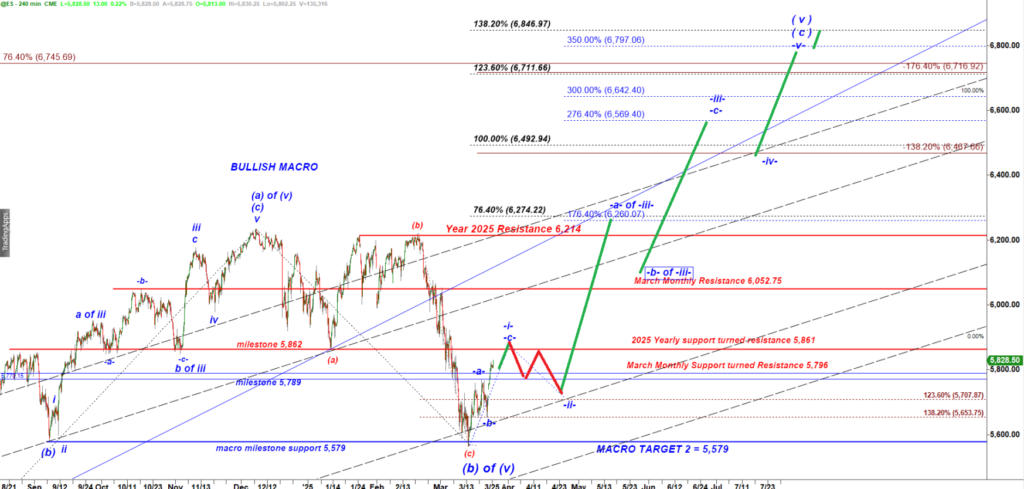
ES-mini 240 min chart posted on March 25, 2025
Every five wave up rally starts from a micro i up, ii down setup.
The wave ( i ) up topped in the Red Target Box.
Bulls consider the Wed drop as a subwave (a) of ( ii ) and that consolidation they consider as ( b ) up of ( ii ) down:
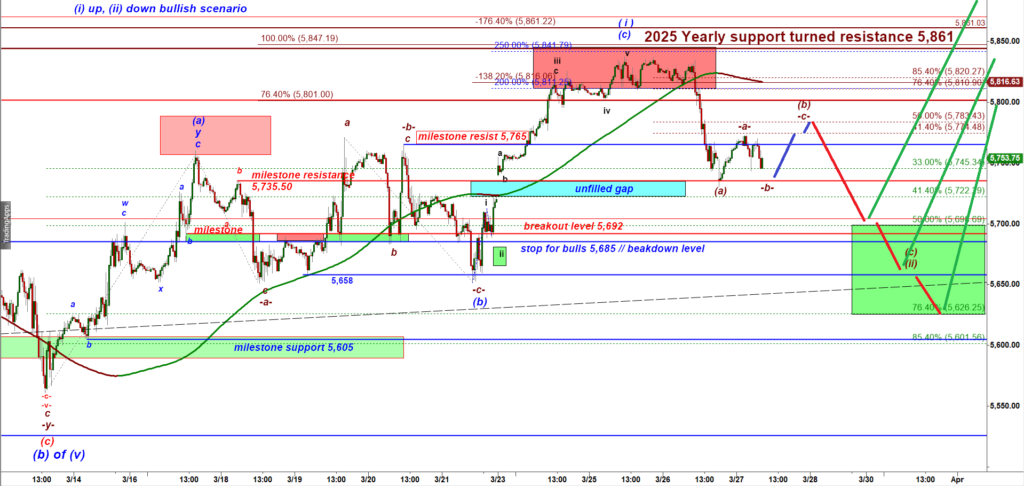
ES-mini 30 min chart
Bulls need to make sure the decline follows a textbook three wave path labelled (a) down, (b) up, (c) down that should make a higher low in the Green Box.
According to the bullish micro, this is what may happen next:
- Bears may try to re-test the Wed low around 5,735, and then
- If bulls stop decline there making an attractive double bottom pattern, they will be able to produce the final leg up of a corrective -a- up, -b- down, -c- up structure of wave (b) up targeting 5,775 – 5,783.
Bears consider the whole three wave up move off the mid month low as a corrective bounce and expect a new impulsive move down targeting 5,000.
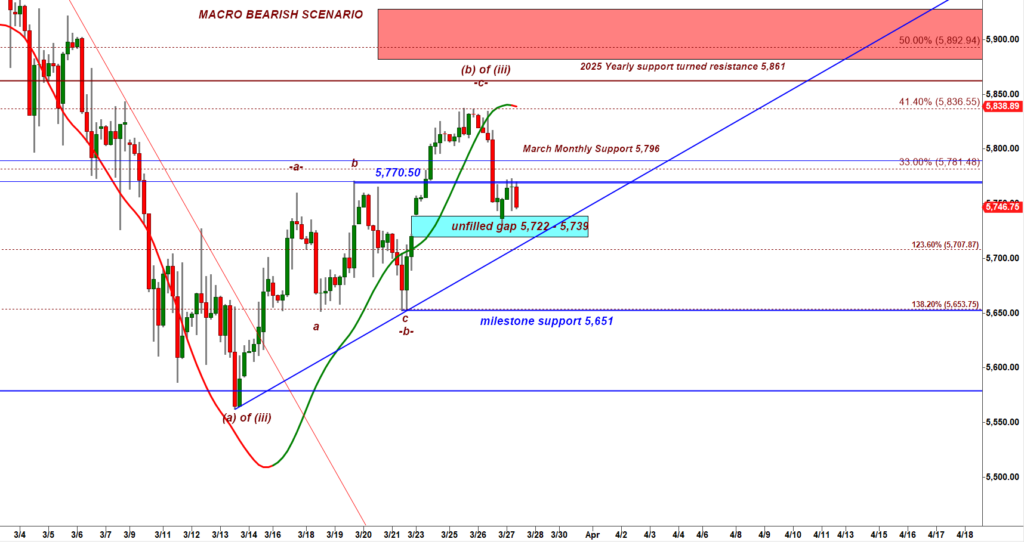
ES-mini 240 min chart
Bears need to break under the lows made yesterday, then fill the gap up (the cyan box) by breaking under 5,722. That break would open the door for a strong decline down to the milestone support 5,651.
MORNING UPDATE – 10-06 am EST
the bearish scenario is in play. Bulls failed to stop decline at 5,735. Bears filled the gap and that triggered a corrective bounce.
Now bears have a setup for another leg down. 5,752 is the micro resistance turned support that needs to get broken to trigger that bearish scenario.
ES-mini 30 min chart
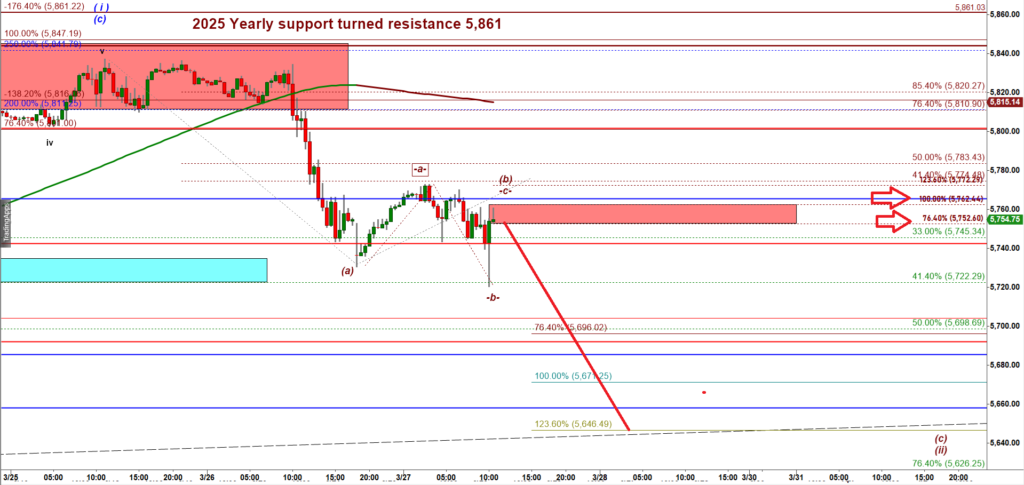
MIDDAY UPDATE posted at 12-27 PM
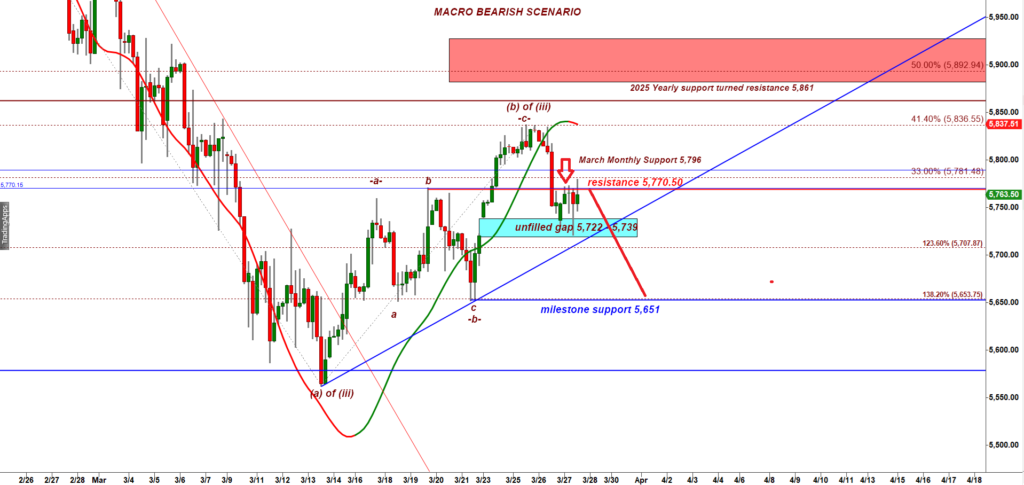
ES 240 min chart
We can see some consolidation over the filled gap. Note that bears can not break back over the resistance 5,770.50. As long as bears hold ES under 5,770.50 I would expect another leg down targeting 5,651 milestone support.