#ES $ES #Elliott Wave #trading setup
Bears managed to break support of the blue trend line.

ES-mini 240 min chart
Moreover, bulls attempted to reclaim that level but the move up failed pre-market. That makes the textbook breakdown-followed-failed-retest-from-below kind of a short setup.
Bears have opened up a big air pocket all the way down to the next milestone level of support at 5,653.
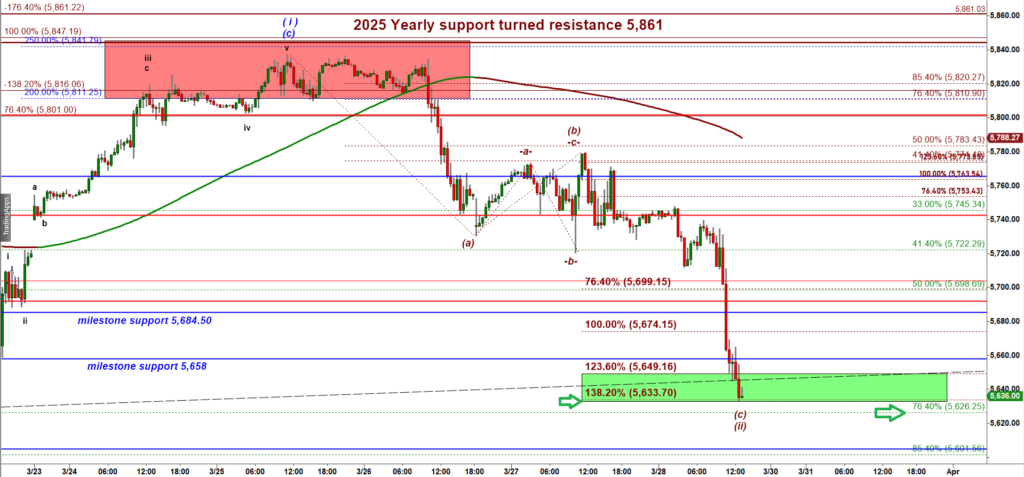
Let’s make one more step out to see even a bigger picture on Daily:

Es-mini Daily chart
So far the super strong macro milestone support 5,476 has been tested once.
That level may get tested and may hold on another test.
So in the most bearish case, if bears push ES under 5,651 micro milestone support, we can see a drop down back to the Mar’25 low made at 5,671 and I would expect another bounce.
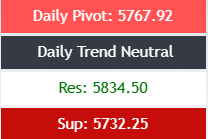
The immediate intraday resistance is the broken daily support 5,732.25.
Bears need to hold ES UNDER that level to keep the down trend intact.
The key intraday resistance is the Daily pivot 5,768. Break over that level would cast serious doubts over the bearish breakdown scenario.
MIDDAY UPDATE – posted at 12-43 PM
As we expected, Es mini plunged:
Es-mini 30 min chart
Now it has tagged the Secondary Daily support 5,630.
There is a bullish scenario where this drop is a subwave (c) of a corrective wave ( ii ) down.
BUT I would wait for confirmation in the form of a recovery that pushes ES back over 5,658 broken support to trigger the long “failed breakdown” setup.