$NQ #Elliott Wave #weekend
Only one trading day remains in March.
Historically, markets often close a month with a final push in the direction of the prevailing trend. Given the sustained decline last week, we may see one last exhaustion move to a lower low today or tomorrow.
Let’s look at a bigger macro picture and then we will get back to a micro wave count at the end.
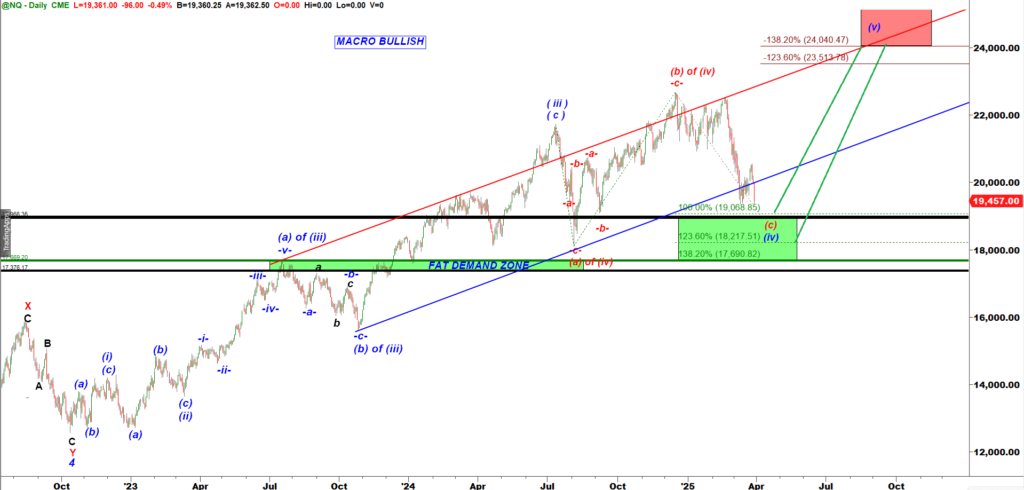
NQ Daily Macro – Bullish Scenario
- The rally off the August 24, 2024 low into the December 2024 high doesn’t look strong enough to be the final wave (v) up.
- It may be more appropriate to count that rally as subwave (b) up of wave (iv) down.
- In that case, the current March 2025 decline could be the subwave (c) of wave (iv) down.
NQ-mini Daily chart
The 120-minute chart shows a clean five-wave structure down.
Micro wave iii bottomed precisely at the 176.4% extension of micro wave i – a textbook move.

NQ-mini 120 min chart
We can identify two clusters of different extensions that may stop the final push lower in a micro wave v down:
Two key Fibonacci clusters could serve as support for the final leg of micro wave v down:
(i) 18,600 – 18,483 and
(ii) 19,068 – 19,013 – 18,933.
Alternative Very Bullish Scenario
- In this count, the August 2024 drop is labeled as subwave (a) down, and the January–March 2025 decline is the second leg (subwave (c)) of a correction.
- If bulls hold above the August 2024 low, it could signal a Running Flat correction — a very bullish pattern.
- This would support the start of a powerful five-wave rally in subwave C of wave 5 up, targeting 28,000 – 30,000 (a potential 40–50% upside).

NQ-Daily, Very Bullish wave count / scenario
Now let’s have a look at a micro wave count on a 15 min chart of NQ-mini:

NQ-mini 15 min chart
We can get that decline to 19,000 before bulls step in and turn the trend back up.