$ES #ES #ElliottWave #trading setup
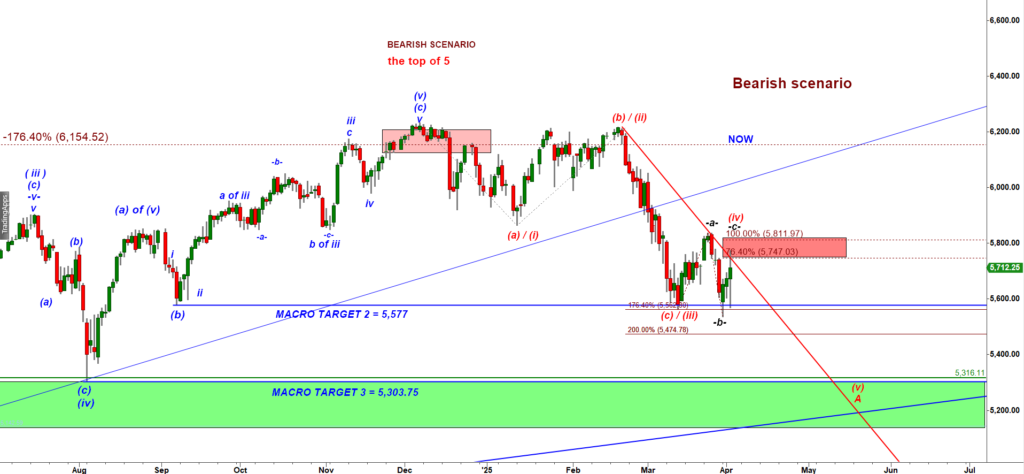
Let’s talk first about the primary bearish scenario.

ES-mini Daily chart
Bears argue that ES-mini made a lasting top in December 2024.
When we deal with a completed a five-wave up rally we anticipate a corrective A-B-C decline to follow.
🔻 Normal Key Downside Targets (Support Levels)
Target 1: (support 1)
- This corresponds to the low made by subwave (b) within wave (v) up.
- For the ES-mini, this level is at 5,577.
- That level has already proven significant, halting two bearish attempts and triggering bounces both times.
- However, the second bounce (early this week) is notably weaker than the first rebound seen in mid-March.
Target 2 (Support 2):
- This is the low of wave (iv) within the completed five-wave advance—a corrective wave one degree lower.
- For ES-mini, this support is at 5,303.75.
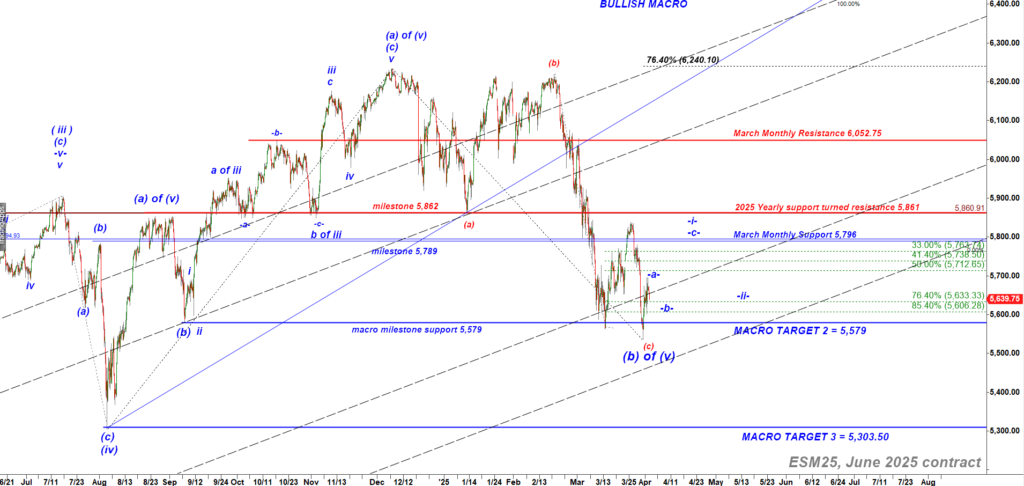
🚨 The current macro wave count suggests another large leg down, potentially targeting Support 2 = 5,303.75.
🔍 Zoom-In: 60-Minute Chart Setup
ES-mini 60 min chart
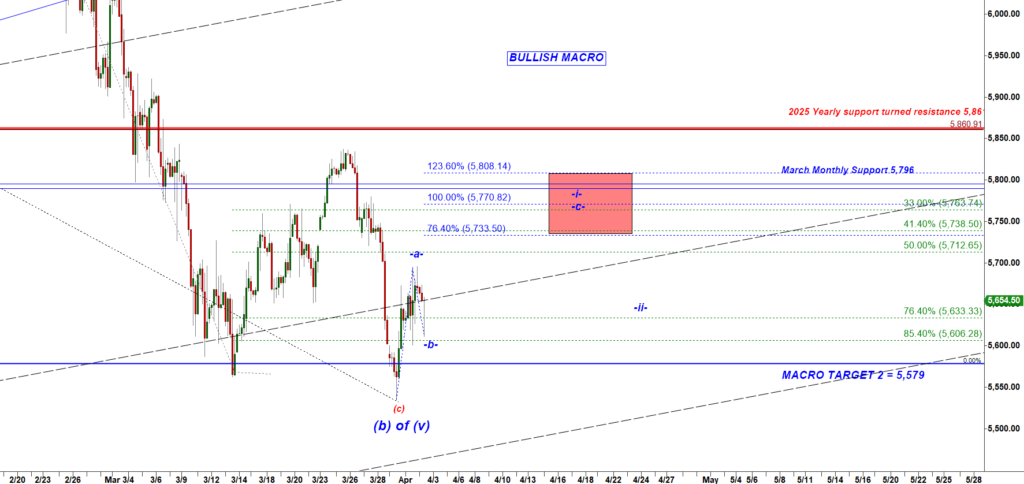
We’re watching a key Red Box zone for a short entry.
- If price tags that Red Box and gets rejected by bears, it should trigger a high-probability short setup.
- So far, the bulls have not been able to push ES-mini to test that area.
🟩 Bullish Scenario — What the Bulls Want to See
Bulls are hoping that the Monday morning low marked the end of wave (b) of (v), and that a new five-wave rally toward fresh all-time highs is beginning.
- For that to happen, the rally must start with a micro wave -i- up, followed by -ii- down.
- As of now, we’ve only seen a very weak bounce—not even enough to qualify as a micro -i- up.
- The price didn’t even reclaim 5,840, a prior minor pivot.
ES-mini Daily chart
📈 Bullish Confirmation Trigger:
- Bulls must break back above 5,796, a broken monthly support for March.
- We’re now in Day 2 of April, and the first 3 trading days of each month often define the range for the rest of the month.
- A breakout above that 3-day high would confirm an intramonth bullish trend.
🌀 Volatility Alert & Macro Risk
- The first few trading days of a new month are historically volatile.
- Often, directional moves seen early in the month are quickly reversed within the next few sessions.
Meanwhile, the market is skittish due to rising geopolitical and macroeconomic tension.
🔺 President Trump is expected to announce new global tariffs today at 4:00 PM EST, stoking fears of a renewed trade war.
🔚 Conclusion
At this moment, neither bulls nor bears have a clearly dominant setup.
Until more price structure develops, especially around key levels, traders should remain cautious. I will be posting intraday updates as soon as I see a compelling micro setup in any direction. Stay tuned!
THE MORNING UPDATE posted at 9-54 AM EST
Let’s look at ES-mini chart.
Bulls can argue that they have started another leg up, a five wave up rally targeting 5,767:
ES-mini 15 min chart
Let’s go micro and look at a tick bar chart:
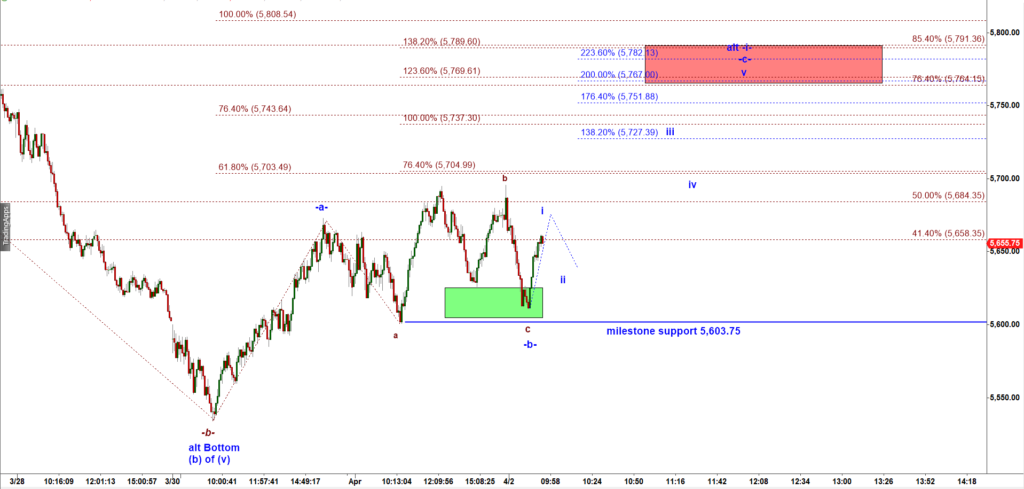
ES–mini tick bar chart
Bulls can count that pop as a micro wave i up. now we need somme pullback in a micro wave ii down.
To keep that long setup alive bulls should hold any pullback over 5,610.75.
AFTERNOON UPDATE – posted at 5-42 PM EST
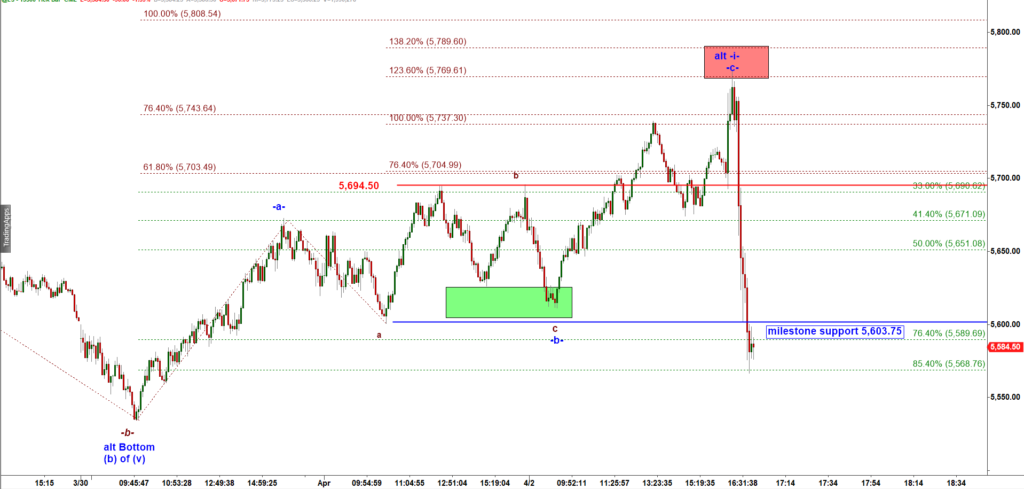
ES-mini tick bar chart
ES-mini rallied from the green box to the red box. It hit the Red Box and tanked.
Our Green Box nailed the morning bottom of the day and the Red Box nailed the top of the day in the afternoon!
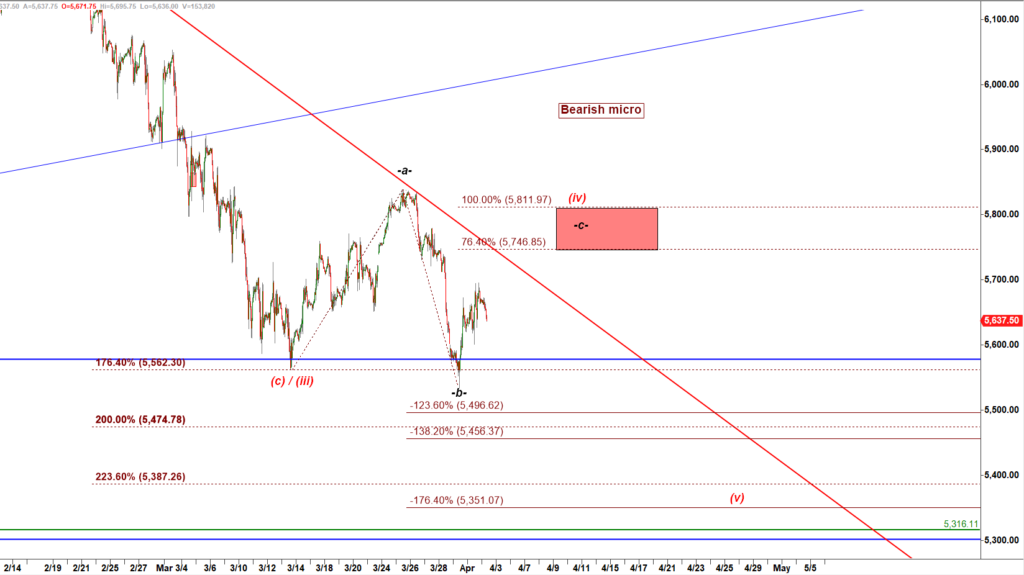
Let’s update our daily chart that shows the primary bearish scenario:
ES-mini Daily chart
AS we expected, ES rallied up to the Red Box and by doing that it completed a bearish -a- up, -b- down, -c- up corrective structure shaped as teh bearish Running Flat.
Now bears got a decent macro short setup that allows them to push ES down to the Macro Target 5,303.