$ES #ES #Elliott Wave
In yesterday’s afternoon update, I concluded that the bears now have a solid macro short setup, with the potential to push ES down toward the Macro Target at 5,303.
Just a reminder—every trading day starts with my pre-market report, where I outline potential tradeable setups. I usually follow that with one or two updates in the morning and afternoon, especially if I spot significant changes or compelling opportunities.
For active day traders, I highly recommend switching to my Premium Chat platform. All updates are posted there first—well before they appear on the website. Plus, I share dozens of real-time intraday updates in the chat room throughout the session.
This is how ES-mini looks like now:
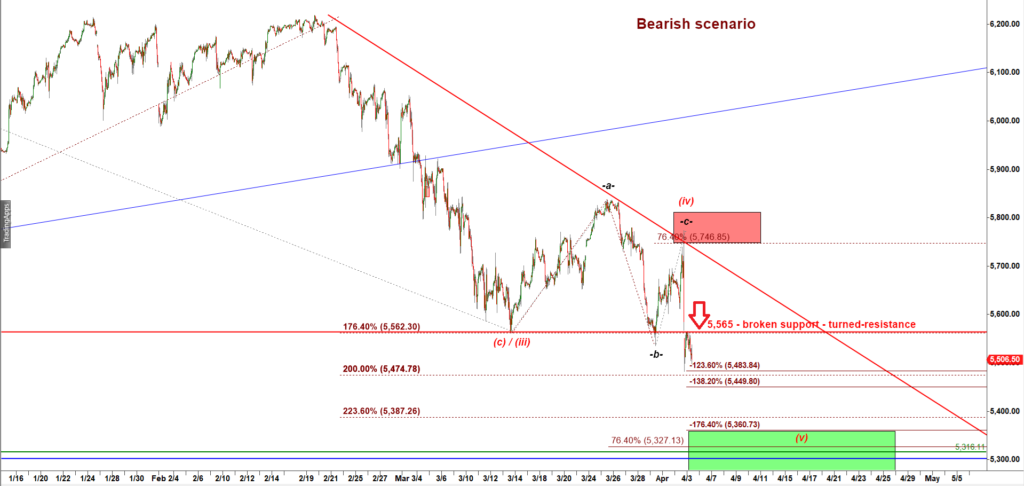
ES-mini 60 min chart
Yesterday, the bulls failed twice.
First, they were rejected at the lower edge of the Red Box. Importantly, the rally that brought ES up to that level formed a lower high—a classic sign of weakening momentum.
Then, toward the end of the session, ES sold off sharply on news of new U.S. tariffs. It broke below the 5,565 level. Even more telling, the bulls tried to reclaim that level but failed again.
So, in one day, the bulls suffered two key failures. And in the stock market—especially one that’s essentially a zero-sum game—every failure has a price. In this case, the likely outcome is another leg down to a lower low. One side wins at the expense of the other—bulls or bears.
The next micro support lies at 5,450, which is a -138.2% Fibonacci extension.
Just a heads-up: a -138.2% extension typically only holds a corrective move, often as part of a subwave b. That means we could see a bounce off the micro green box shown on the chart, but it may just be a pause before the next move lower.
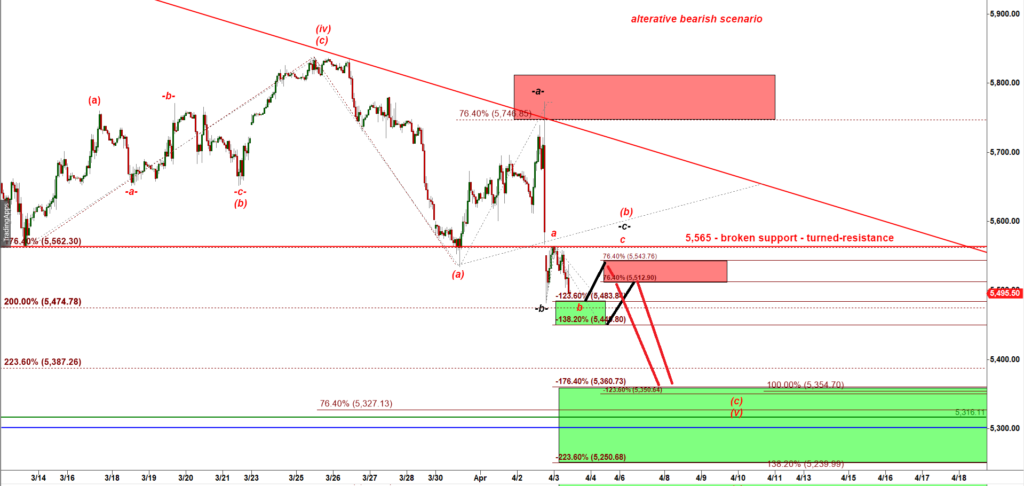
ES-mini 60 min chart
alt path 1 = down to 5,484 -> up to 5,544 -> down to 5,360
alt path 2 = down to 5,450 -> up to 5,512 -> down to 5,360.
MIDDAY UPDATE posted at 11-50 PM EST.
ES-mini has made another lower low and by doit that it produced enough waves to consider it having bottomed:
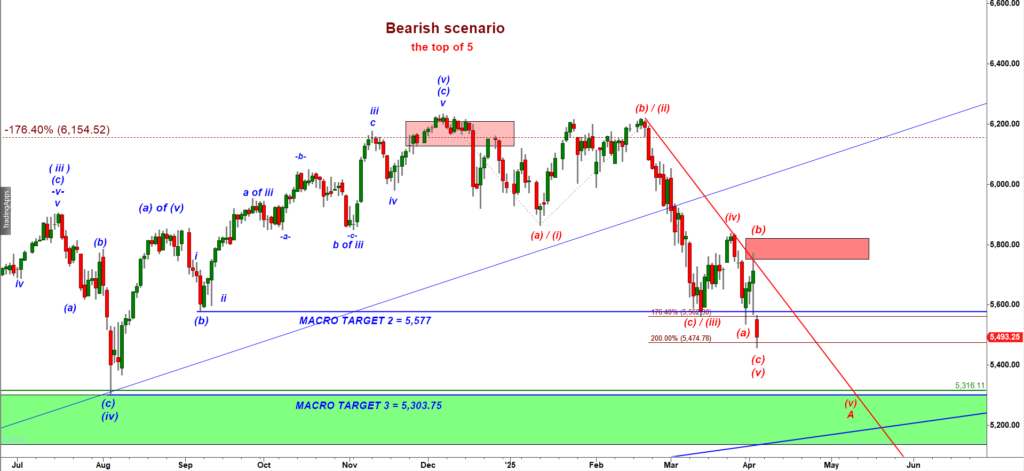
ES-mini Daily chart
Macro wise that is a bearish picture. Because a five wave down decline means that down is the prevailing direction of the trend and the market is controlled by bears. But upon completion of a five wave down decline we always expect a three wave up bounce.
 5,848 would be the ideal target for the second leg up for that (a) up, (b) down, (c) up bounce.
So far we can not be sure that ES has bottomed. It has not tagged the Green Demand zone yet.
To confirm that bulls need to break over 5,520 and then over 5,540.