$SPX #S&P 500 #Weekend #Macro Updtae
🔍 Weekly Chart – Macro Analysis
Let’s update our macro perspective on the S&P 500.
At this point, we can reasonably conclude that the strongest phase of the rally off the 2009 low is complete.
Under the bearish blue count, bulls can still argue that we’ve only seen the top of macro wave (3) up and have now entered a corrective wave (4) down.
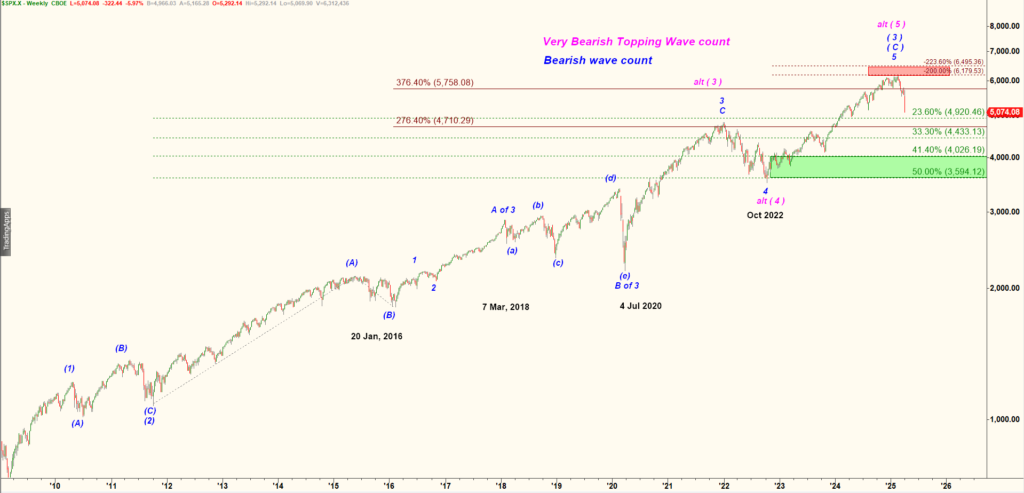
S&P 500 Weekly chart
This wave (4) is expected to unfold as a three-part correction:
- (A) down
- (B) up
- (C) down
That structure would imply that the subwave (C) of (4)—the second leg down—could test the 4,000 level, which also represents a 50% Fibonacci retracement of subwave (C) of wave (3) up.
✅ The good news for bulls: This structure still leaves room for a final wave (5) up upon the completion of the (A)-(B)-(C) correction.
🚨 The bad news: If this count plays out, the correction will likely extend over the course of a year.
To validate this macro wave count, we need to confirm that the current decline unfolds as a three-wave structure that finds support at one of the support levels I will indicate in that report below.
🕰 240-Min Chart – Zooming In
When a rally tops and a corrective move begins, the first step is to apply Fibonacci retracement levels to the previous five-wave rally. Here, we’re analyzing the move up from the October 2020 low.
Key Fibonacci retracement levels:
- 41.4% = 5,052.72
- 50% = 4,837.00
🔍 On Friday, the S&P approached that first key support level at 5,052.72.

S&P 500, 240 min chart
Also important:
The prior wave 4 low from August 5, 2024 = 5,119.26. This now becomes a critical resistance level. Bulls need to reclaim this level to trigger a bullish failed breakdown setup.
⏱ 30-Min Chart – Micro Structure
The decline is currently unfolding as a corrective (a)-(b)-(c) structure, which does not appear to have bottomed yet.
S&P 500 30 min chart
📉 On Friday, the S&P hit the 200% extension of the initial decline.
The ongoing micro wave (iii) down may still extend toward the 223.6% Fibonacci extension = 5,026.
⚠️ There’s also a 20% – 25% probability that wave (iii) could overshoot to 4,987, which would be a textbook extended wave scenario.
➡️ A gap down on Sunday afternoon or Monday is possible. Bears can push the index to test 5,026 or even 4,987.
However, I would expect a bullish reversal off one of those levels.

S&P 500 30 min chart
🧭 What Comes Next
Once wave (iii) down completes around one of two levels of support (5,026 or 4,987), we should see a corrective wave (iv) up, targeting the 5,174 – 5,246 area.
📌 Key resistance lies at:
- The lower edge of the April 4th gap down = 5,292
🚨 Bears remain in control until bulls can break above 5,292 and fill the gap, pushing the S&P toward 5,390, which was the broken monthly support for April.
🔁 Back to the Weekly Chart – Summary
To recap the key Fib levels:
- 41.4% = 5,052.72
- 50% = 4,837.00
📌 Bulls need to hold the 5,026 level to keep the structure constructive.
⚠️ A break below 5,026 would be a bearish development, suggesting further downside and increasing the probability of testing deeper support levels.
🔍 ES-mini: Micro Wave Count Analysis
Quite often, the wave counts of the S&P 500 and the ES-mini appear different.
There are two main reasons behind this discrepancy:
- The S&P 500 is a paper index — essentially a mathematical average of 500 companies’ stock prices. It is not a tradable instrument.
- The ES-mini, on the other hand, is a futures contract that trades nearly 24/7. It includes overnight price action, while the S&P is calculated only during regular trading hours.
Because of this, the sharp, accelerated drop we saw on Friday is only visible on the ES-mini and is best interpreted as the heart of the decline in subwave (c) of wave (iii) down.

ES-mini Daily chart
📉 What the Micro Count Suggests
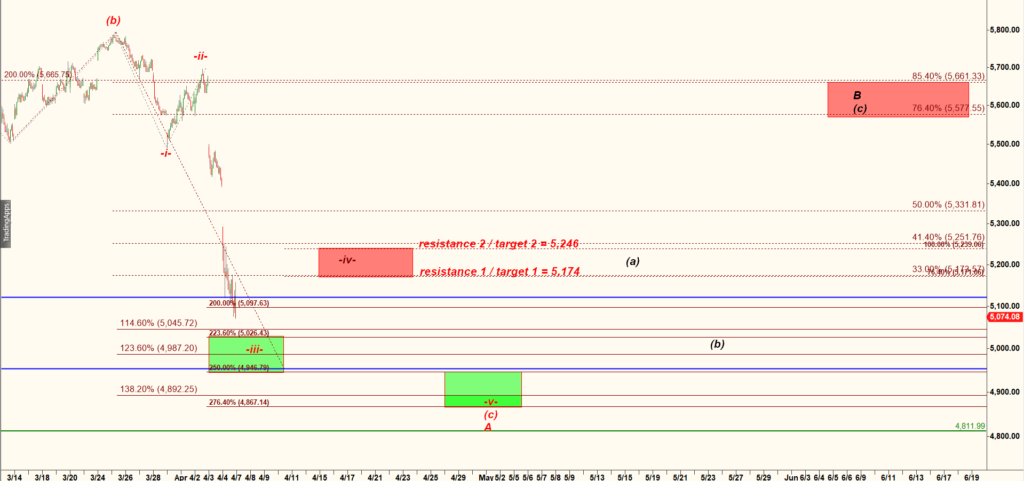
Let’s zoom in on the tick bar chart to analyze the micro wave structure:

ES-mini tick bar chart
I don’t see a compelling reason why bulls couldn’t produce a pullback to the 5,238 – 5,280 zone tonight.
On Friday afternoon, they pushed the ES-mini to a meaningful 223.6% Fibonacci extension of micro wave -i- down — a classic target for wave -iii- down.
Now, based on this structure, the typical target for wave -v- of (c) of (iii) is the 138.2% extension of wave (a) of (iii), which comes in around 4,914.
So if we get a bounce this afternoon, the wave count implies that the move up will likely be short-lived, followed by one more leg down on Monday, potentially completing the structure near 4,914.