$NQ #NQ-mini
Macro Wave Structure Analysis: Bearish Impulse & Corrective Rebound
The sharp decline from the December 2024 high appears to be impulsive in nature, suggesting the early stages of a larger bearish trend. This move can be interpreted as an unfolding five-wave structure to the downside, which does not yet appear complete.
The accelerated drop into Sunday night’s low likely marks the culmination of wave (iii), with the final leg of that move—subwave (c)—showing classic traits of an extended impulse. This would imply that the market is currently in the midst of a wave (iv) corrective pullback.
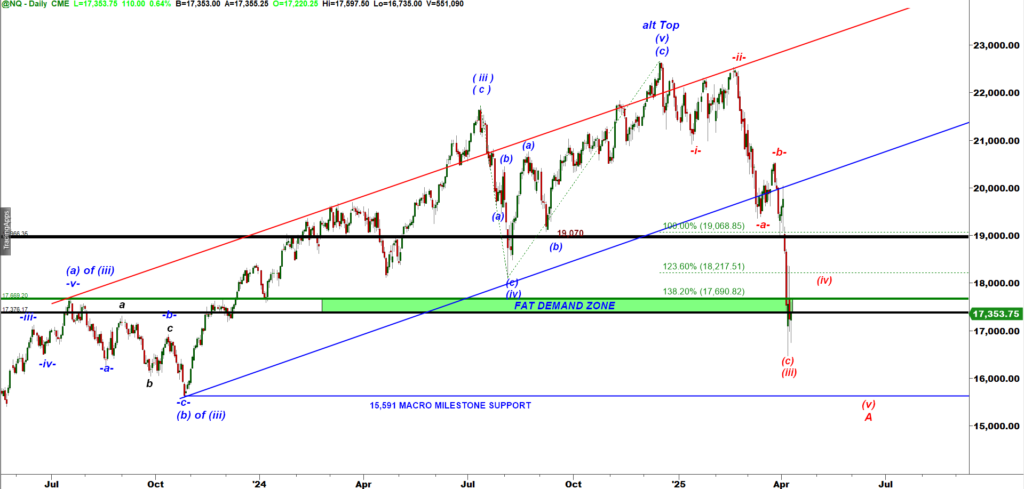
NQ-mini Daily chart
Near-Term Outlook (Zoomed-In View: 15-Min Chart)
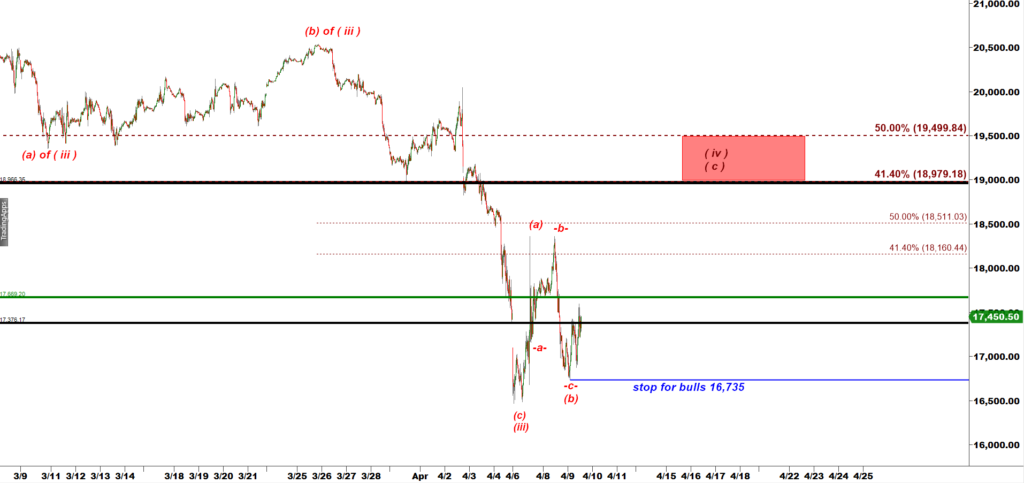
In this scenario, we are now monitoring a corrective rebound taking shape as wave (iv) up. Within this structure:
- The current price action may be unfolding as a three-wave move: (a)-(b)-(c), with the next leg up likely being subwave (c) of wave (iv).
- Upside targets for this move could reasonably reach 18,500, with a possible extension up to 19,000, depending on momentum and participation.
ES-mini 15 min chart
Key Support Level for Bullish Continuation
For this bullish retracement scenario to remain valid, NQ must hold above the immediate support at 16,735 at all times. A breakdown below this level would invalidate the wave (iv) thesis and suggest a potential early resumption of the wave (v) decline.
BONUS: Pivot Analysis:
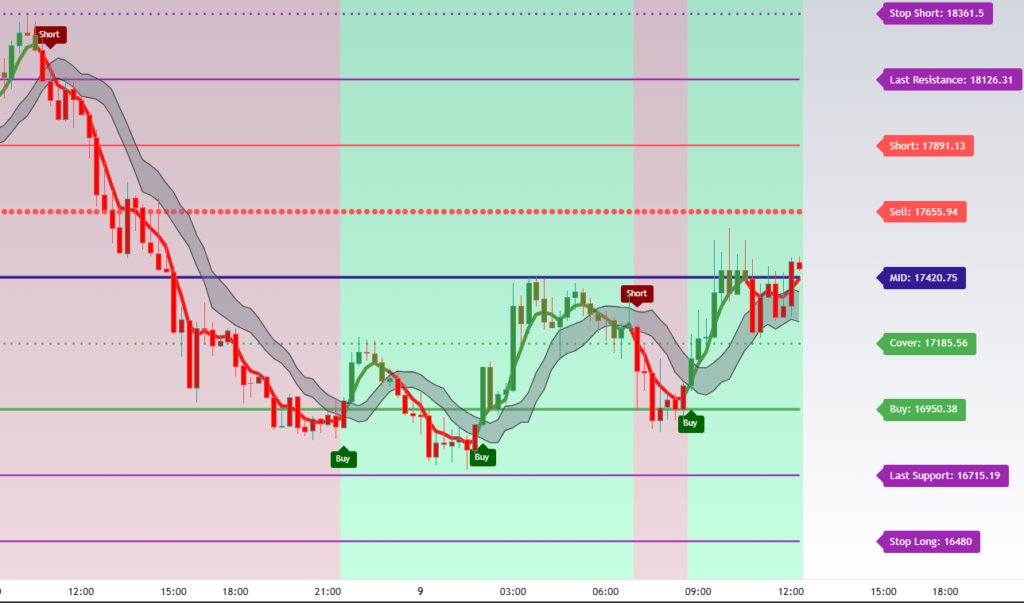
Weekly Pivot – The Mid Line as Equilibrium
The blue mid line, labeled as MID: 17,421, represents the weekly pivot point, which serves as the equilibrium price for the week. This level is a key reference for market participants because it acts as a psychological and technical barrier that divides market sentiment:
Above the mid line: The market is considered to be in bullish territory.
Below the mid line: The market is viewed as bearish. In this context, 17,421 is the pivot that determines the broader directional bias for the week. As illustrated on the chart, this level rejected a rally attempt earlier in the session, reinforcing its importance as resistance.
Trading Implication A sustained break above 17,421 is likely to trigger a bullish scenario, signaling that buyers have taken control and that a continuation higher may be in play.
Conversely, failure to reclaim this level keeps the bearish structure intact, favoring opening short positions on a break under 16,950 pivot.
MIDDAY UPDATE posted at 2-28 PM EST
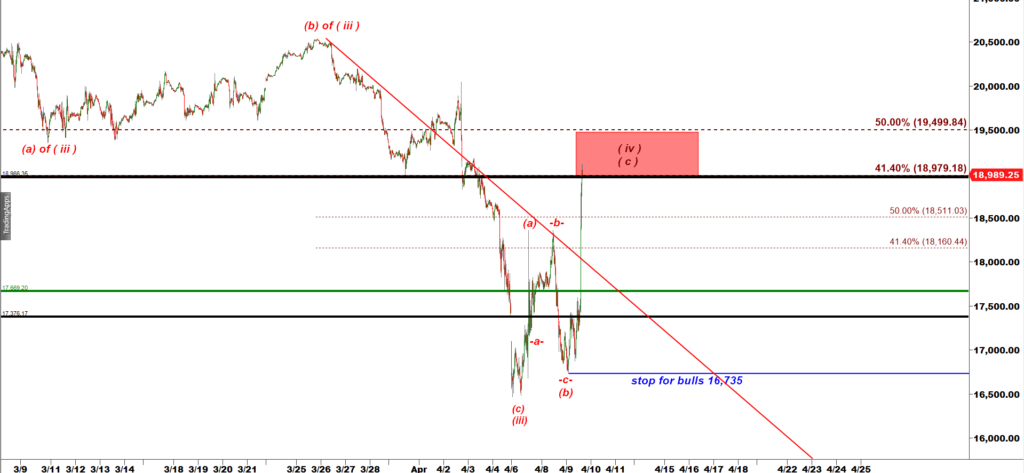
As we expected, NQ popped up into the Red Box!
That pop looks like a textbook completion of a corrective (a) up,, (b) down, (c) up pullback.
That wave count allows bears to start another leg down in a wave ( v ) down to a new lower low.