$ES #ES-mini #Elliott wave
On Friday we tracked a grinding move up into the Red Supply zone
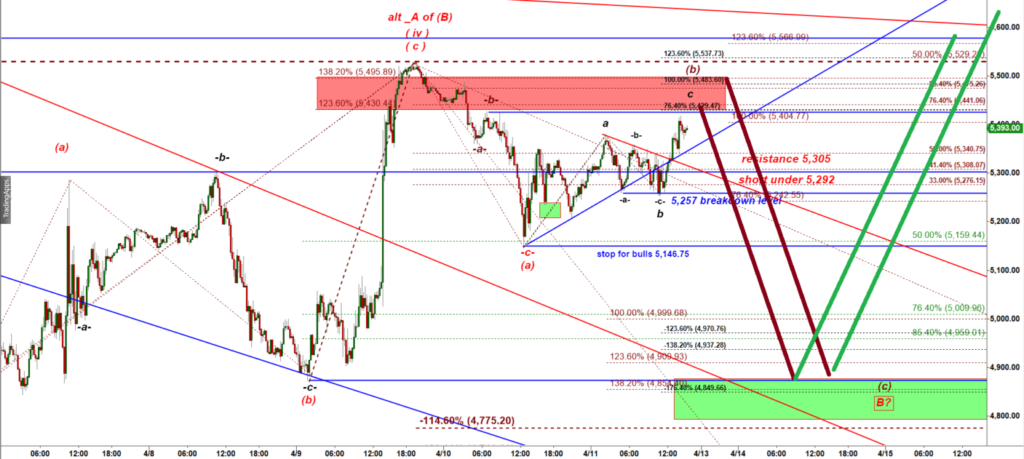
ES-mini 15 min chart posted on Friday
As you can see, the higher red line pointing down started from inside the Red Zone.
So we expected that price could spike into the Red Zone.
Tonight the low liquidity Sunday evening session started with that spike. That gap up does not change the bearish wave count we tracked on Friday.
ES has gapped up into the Red Zone tonight and immediately got under selling pressure:
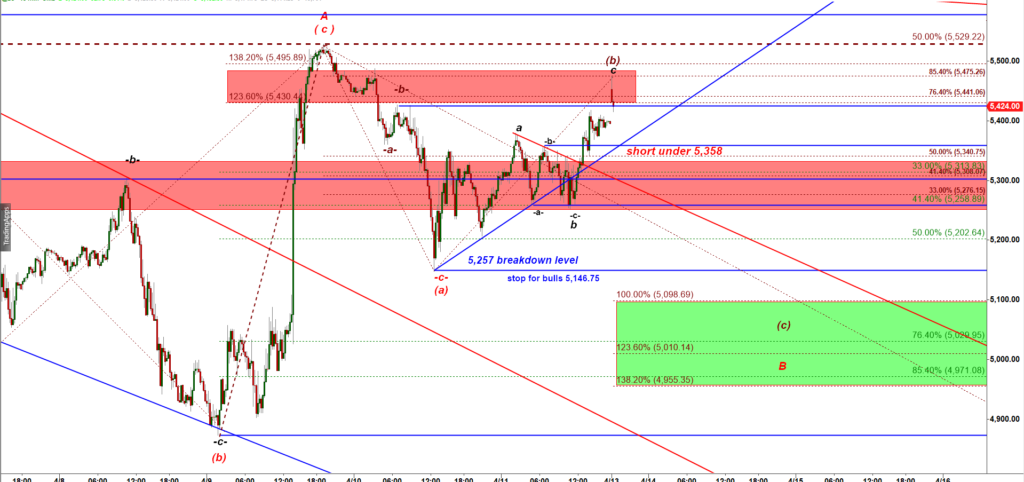
ES-mini 15 min chart
That spike and exhaustion gap up could be the perfect completion of a subwave c of wave ( b ) up. A completed wave (b) up should be followed by a strong drop in a wave (c) down that should be able to test the Green Box.
The first confirmation of a bearish reversal would be a drop under the Friday high 5,400. If bears manage to fill the gap up that would be the first bearish sign