$ES #ES #Elliott Wave #fake rally
This move up has a clean a up, b down, c up subdivision. This is what we want to see behind a wave B up:
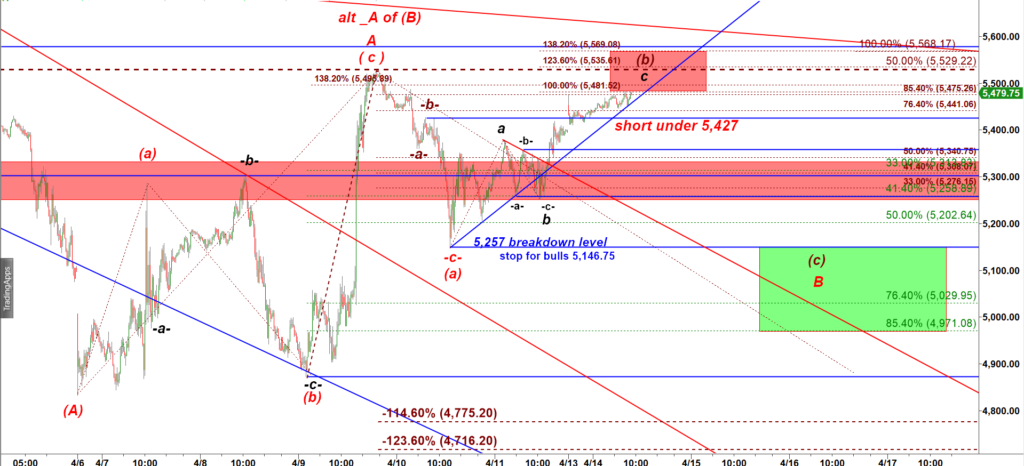
ES-mini 15 min chart
Waves B are very difficult to trade because they literally break the rhythm of the market. Normally a corrective Wave B takes 2x to 4x times more than wave A took. Even when you know its a corrective wave B that thing keeps stretching and stretching and stretching.
The subwave c of wave (b) up c up may extend up to 138.2% ext of a up. In that extreme case it can tag the upper edge of the red box = 5,569.
The milestone resistance 5,47 got broken and then re-tested from above.
Now that level is a breakdown level. Break under that level would confirm the bearish reversal and start of the wave (c) down.
MIDDAY UPDATE posted at 12-43 PM EST
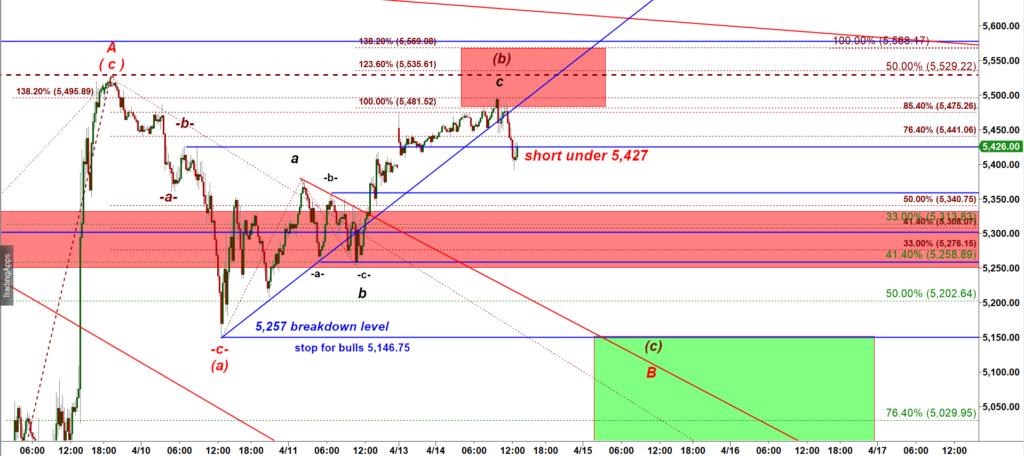
ES-mini 15 min chart
So far it looks encouraging for bears. Price violated the support 5,427 and then popped back over it. Bears try to pretend nothing has happened.
Failure to get back over 5,427 level should trigger an accelerated move down.
Bears have a setup to push ES all the way down to the Green Box.