#ES #long setup #Elliott Wave #complex correction #w-x-y correction
Bears can push ES-mini down one more time to complete the w-x-y down structure:
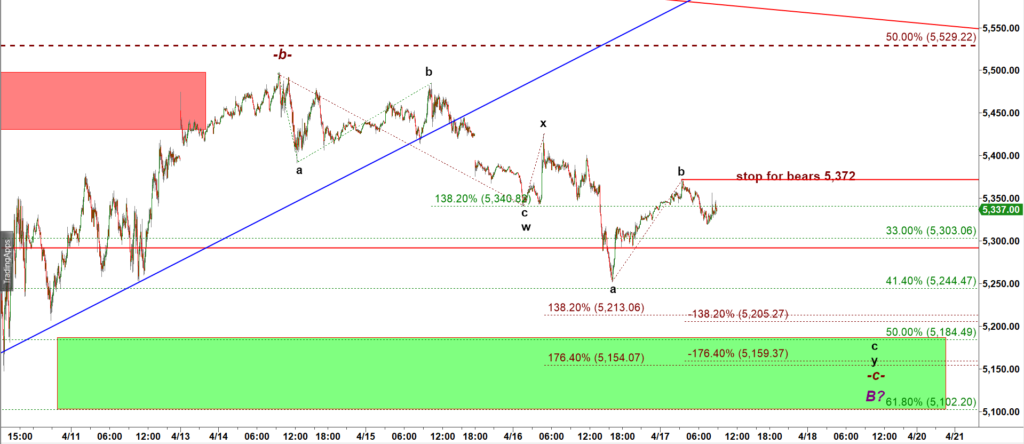
ES-mini 5 min chart
We have been expecting that move down. But we also expected that this decline would be followed by yet another rally to 5,700.
I have two paths to 5,700 from here. The first path is the micro bearish one that argues for one more push down (shown above),
But there is another more bullish path.
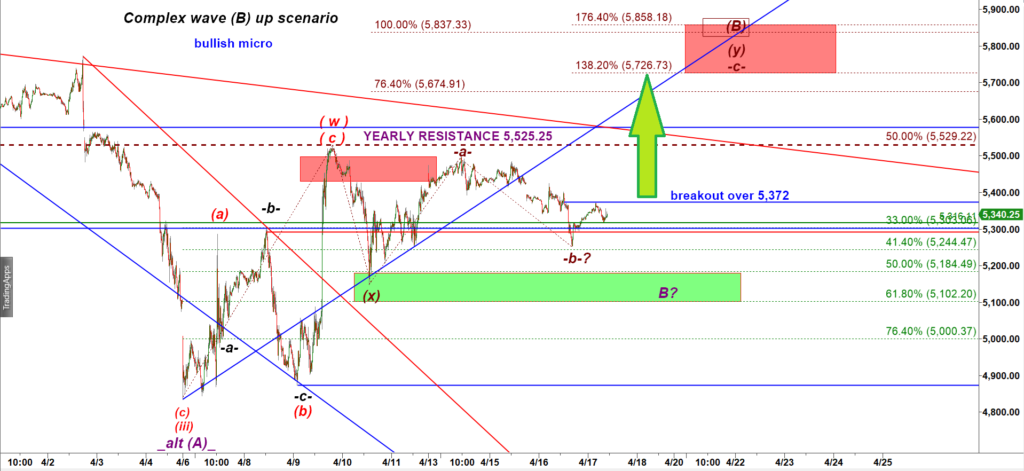
ES-mini 15 min chart
 If bulls manage to break over 5,372 they can trigger a strong rally
  in a subwave -c- of wave (y) up targeting 5,675 – 5,725.
Note the US stock market will be closed tomorrow in the observance of Good Friday holiday.
So today will be the last trading day of this week. It may work as the normal Friday when retail feels the most bullish. If bulls manage to break over 5,732 , it should not take long time for small traders to climb on a bullish band wagon and end the week on a cheerful note.
MACRO OUTLOOK:
Both scenarios shown above consider the A-B-C move up off the April low (scenario 1) or complex (w)-(x)-(y) pullback off the April low (the micro scenario 2) as a large corrective wave (B) up that should be followed by another strong wave of selling.
Let’s zoom – out to a 120 min chart to see a bigger picture:
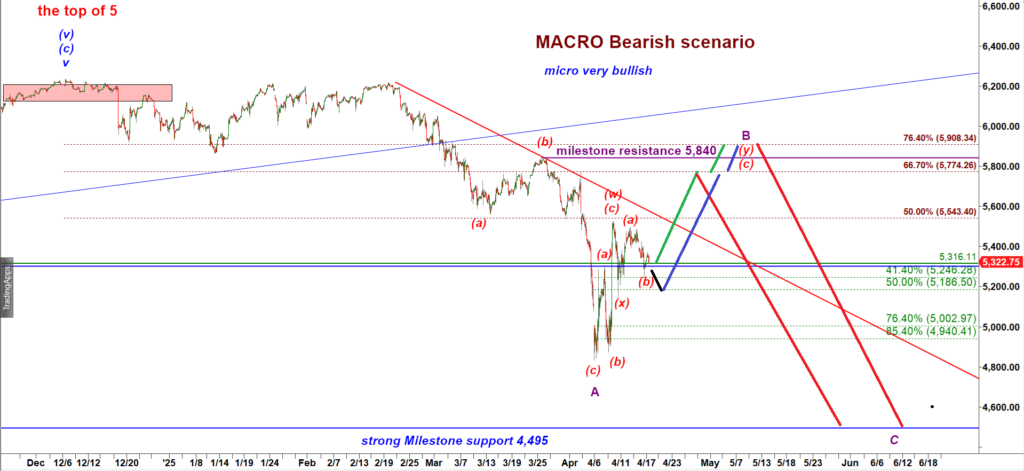
ES-mini 120 min chart
MIDDAY UPDATE posted at 12-10 PM EST
PLAN A: Bullish: Bulls prepared a starting i up, ii down long setup for a five wave up rally in a wave -c- up. To trigger that bullish scenario they need to push ES over 5,372
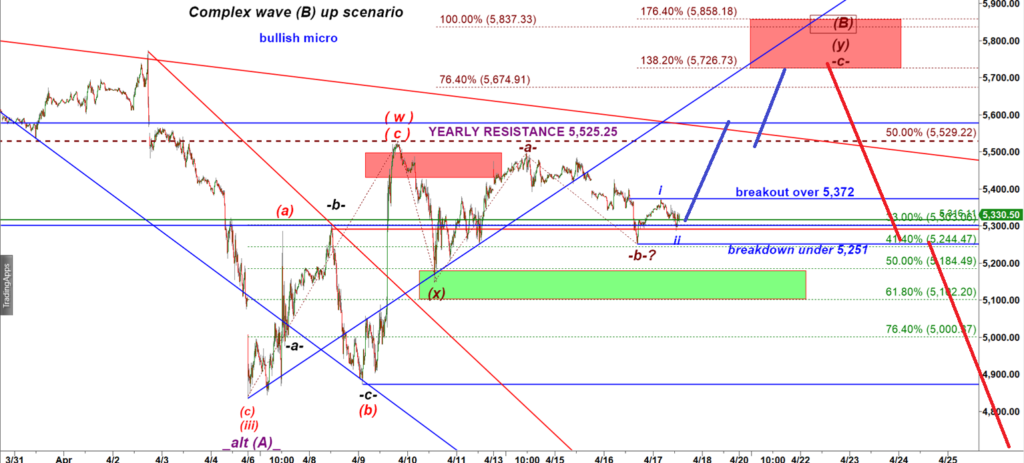
ES-mini 15 min chart
PLAN B: Breakdown: break under 5,251 would invalidate the micro bullish i up, ii down setup and trigger a strong drop down testing 5,146.75, the low made of April 10.