$ES #ES-mini #Elliott wave #trading setups #education #pivots
On Thursday evening I posted an update where I shared my target for the Thursday rally and predicted a pullback.
Es-mini played by our script: it hit the upper edge of the Red Target box and then rolled over.
As we expected, bulls managed to push ES to the upper edge of the Red Box and this is where they run out of gas.
As I mentioned in the evening update, there is a rule I personally came up with:
- a push up inside a corrective bounce normally tops at a negative 1387.2% ext of the preceding decline, while
- a push up inside am impulsive or trending rally normally stretches up to a negative 176.4% extension of the preceding decline (often extends up to 200% or 223.6%).
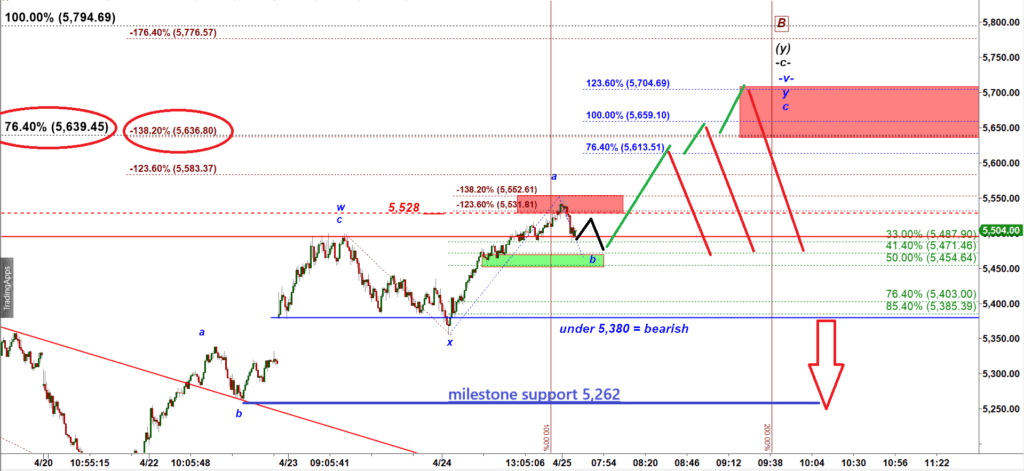
ES-mini tick bar chart
You can see a tight confluence of two extensions at 5,639. That is the ideal minimum target for the final push higher. But first ES needs to complete a corrective micro subwave b down that started overnight.
We will keep watching price interaction with a strong resistance of the Yearly Pivot 5,499.25 in ES-mini.
Yes, bulls managed to overshot that line yesterday. But my experience says that can not be considered a breakout.
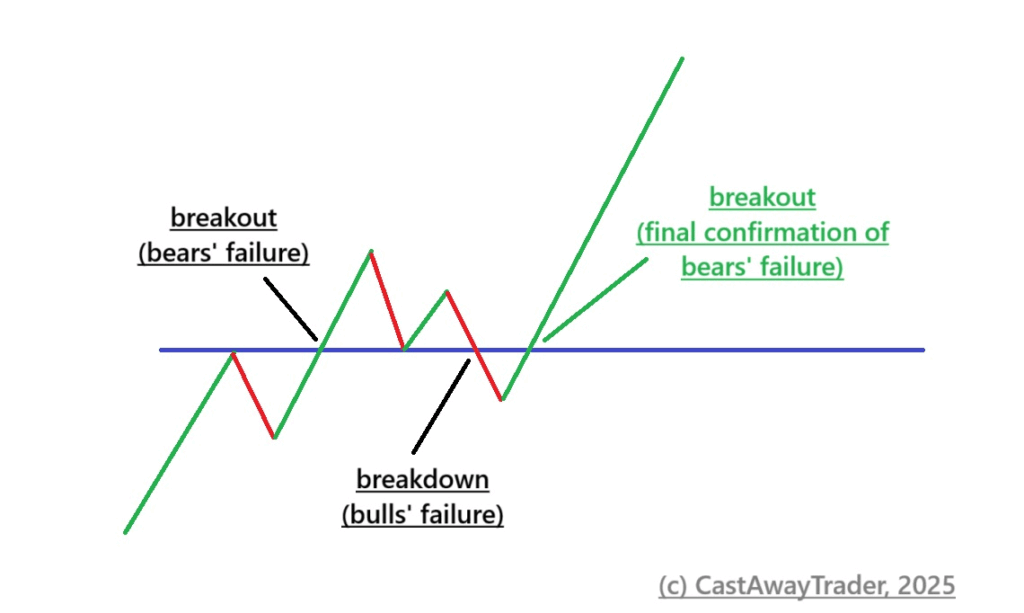
Understanding the Anatomy of a Breakout
In technical trading, price action around major resistance levels is often misleading. What appears to be a clear breakout is frequently just the beginning of a more complex narrative—a three-act structure that determines whether control shifts decisively from bears to bulls.
Let’s examine this phenomenon using a recent interaction with the Yearly Pivot at 5,499.25 in the E-mini S&P 500 (ES) as a case study.
Act I: The Initial Breakout – Bears’ First Failure
The first act begins with what many traders perceive as a breakout: price overshoots a significant resistance level. This was observed yesterday when the ES briefly surged above the 5,499.25 pivot.
However, experienced traders know better—this single move is not sufficient to confirm a breakout. At best, it sets the stage. A true breakout is not a one-act event but rather a two-part performance (often three).
Act II: The Retest – Bulls on Trial
The second act introduces conflict. After the initial push above resistance, momentum stalls. Bulls begin to lose steam, unable to drive price significantly higher. This opens the door for bears to reclaim control.
The climax of this act occurs when price pulls back to the broken resistance level. This retest is critical:
- If bulls succeed in holding the level from above, the breakout is confirmed. Former resistance has turned into valid support.
- If bears succeed in pushing price back below the level, the breakout fails. Control returns to the bears, and the resistance holds strong.
This retest is not merely a price checkpoint—it is a psychological battlefield between two opposing forces.
Act III: The Final Resolution – A Tiebreaker
In many cases, the market delivers an additional act of indecision. The level becomes a magnet for price, drawing repeated tests from both sides. What follows is a three-act drama of failure and reversal:
- Failure #1 – Bears’ Failure: Price overshoots the resistance; bears fail to defend the level.
- Failure #2 – Bulls’ Failure: On the pullback, bulls fail to defend the broken resistance as new support.
- Failure #3 – Bears’ Second Failure: Price drops back below the level, but bears once again fail to hold it down. Bulls reclaim control and push decisively higher.
This third act is the final confirmation of a true breakout. It not only demonstrates that bulls have taken control, but also reveals that bears have expended their strength attempting to suppress the rally—and failed twice.
Practical Takeaway
Breakouts around critical levels are rarely clean. They are best viewed as multi-phase processes that test the conviction of both sides. Traders should be wary of treating the initial move above resistance as definitive. Instead, they should await confirmation through:
- A successful retest (preferably on decreasing volume),
- Clear failure of bears to reclaim the level,
- And momentum re-acceleration in the direction of the breakout.
This patient, pattern-aware approach will help traders avoid the traps of false breakouts and position themselves for the real move when it finally unfolds.
MIDDAY UPDATE – posted at 11-57 AM
ES looks ready to start another final leg up in a micro wave c of wave y of -c- of (y) of B up.
The target is the lower edge of the large Red Box:
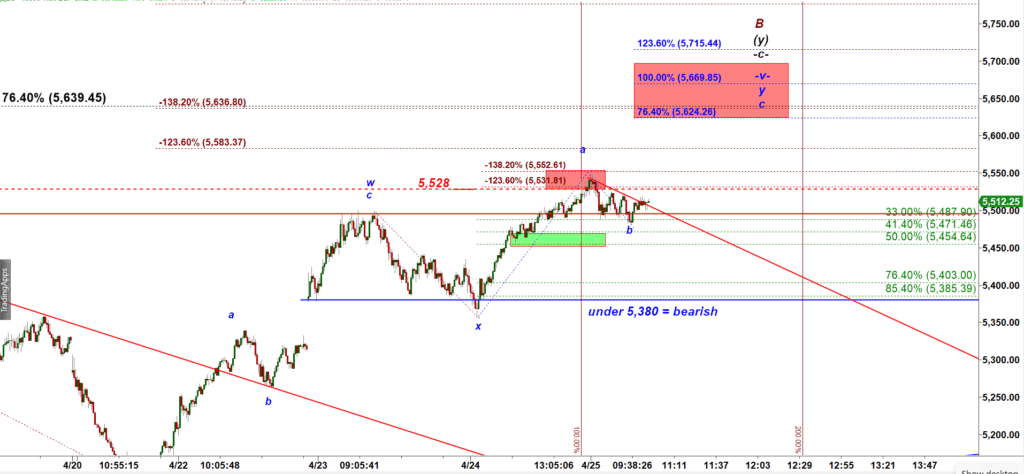
ES-mini tik bar chart