$ES #ES-mini #a-b-c up #corrective pullback
After a sharp drop, the ES-mini found strong support in early April. Since then, price action has been forming a large corrective structure composed of (a) up, (b) down, and (c) up waves.
There are two potential ways this pullback could complete.
Scenario 1. Straightforward (Less Probable) Scenario:
📈 Bullish Completion:
Bulls would need to push ES-mini higher one more time to at least 5,667 — the lower boundary of the large red resistance box — to complete the (a)-(b)-(c) corrective pattern.
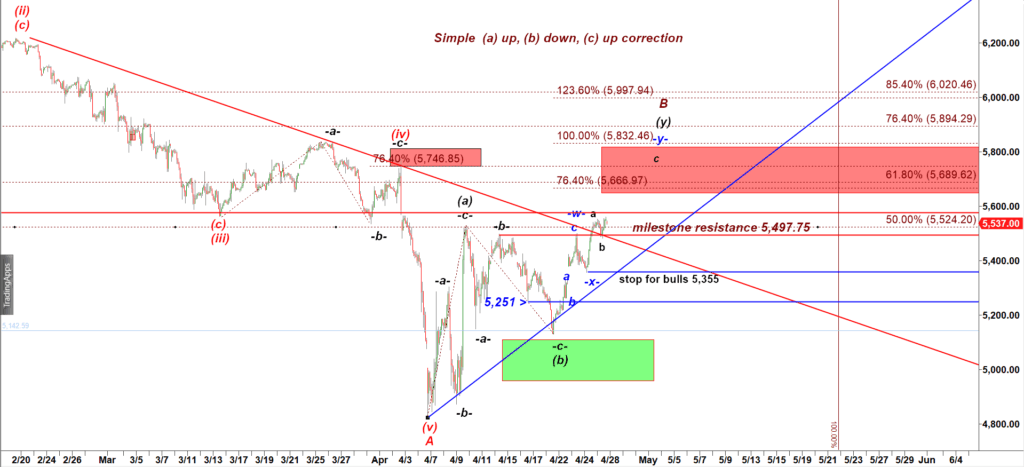
ES-mini 120 min chart
Zooming-in:
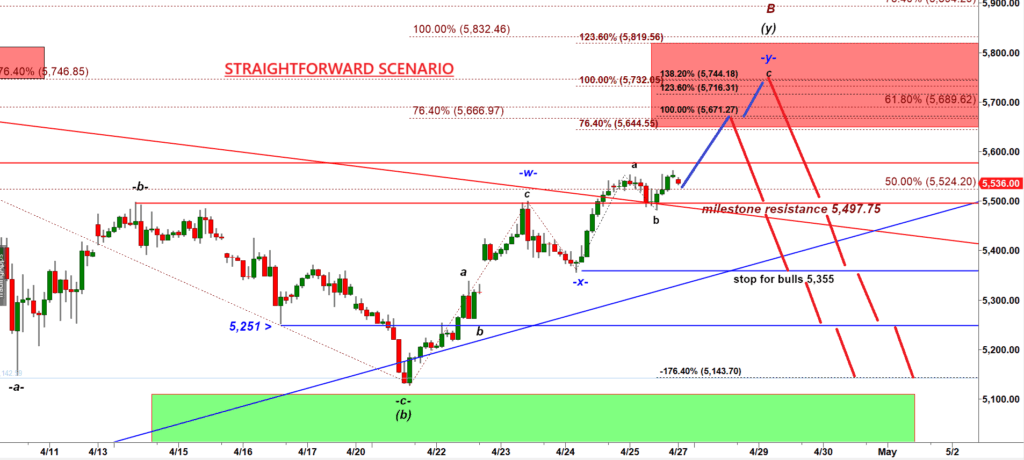
ES-mini 120 min chart
🔑 The critical level to watch for this simple bullish scenario is 5,497.75 — a former resistance level that has turned into support.
- Break below 5,497.75 would likely invalidate this “one more push up” bullish path and open the door to a more complex correction.
2. More Complex Corrective Scenario:
As noted previously (Friday update):
- “If we measure the active stage of the decline (see the red arrow), we can see that this wave B up has not lasted even half of the time consumed by the preceding decline yet! That means bulls have much more time for that corrective structure. …“If we understand that the wave B up did not burn enough time then we may assume that this move up can not be the final wave ( c ) up.“
To activate that path bears need to push ES back under teh key resistance 5,497.75:
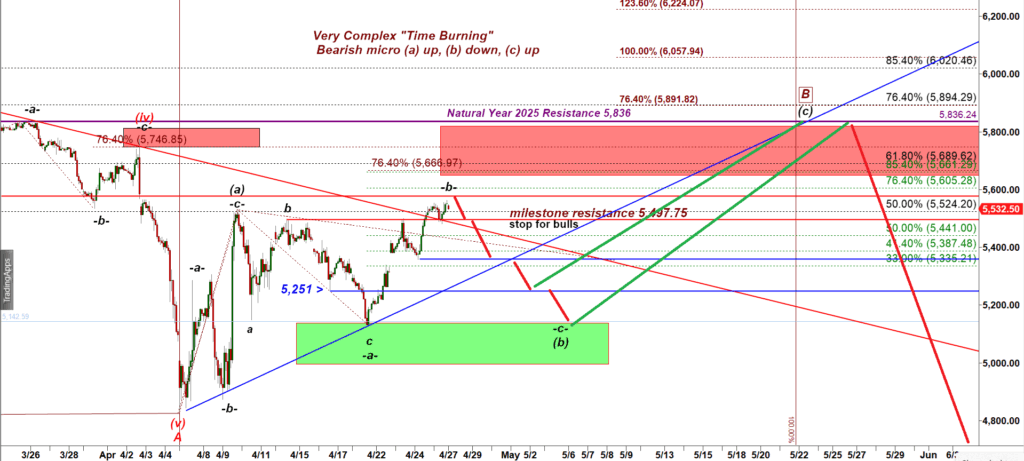
ES-mini 120 min chart
We can identify two main overhead resistance levels. Even under the second more complex scenario, this rally may stop at 5,586.50 (hitting the resistance inherited from the Natural Year opening range of 2024).
If that resistance level gets broken and then getting re-tested from above, bull will have a chance to push ES-mini all the way up to the resistance set by the Yearly Opening Range 2025 = 5,836. The second level could be the final destination of the subwave (c) of wave B up.