#ES-mini #Elliott Wave #trading setup
Yesterday we discussed two paths for this corrective consolidation:
(1) Straightforward path (“one-n-done”):
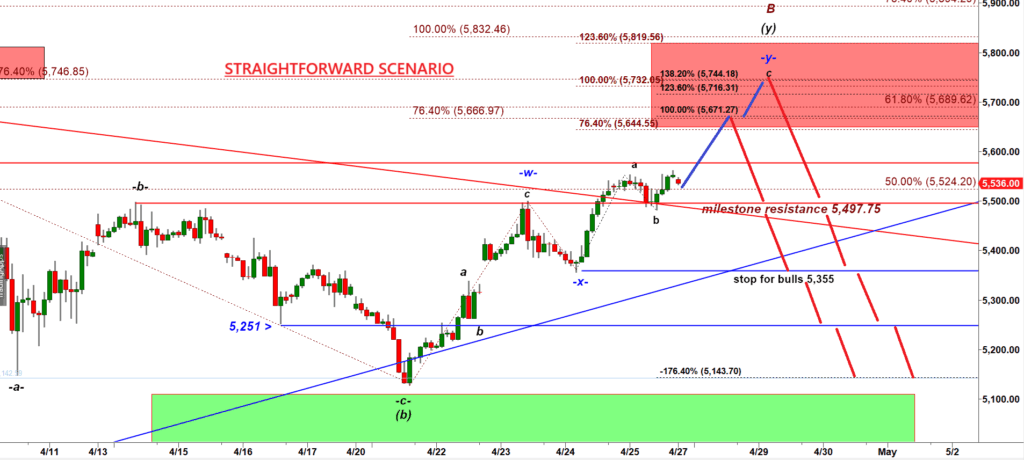
ES-mini 120 min chart
(2) More Complex (time burning scenario):
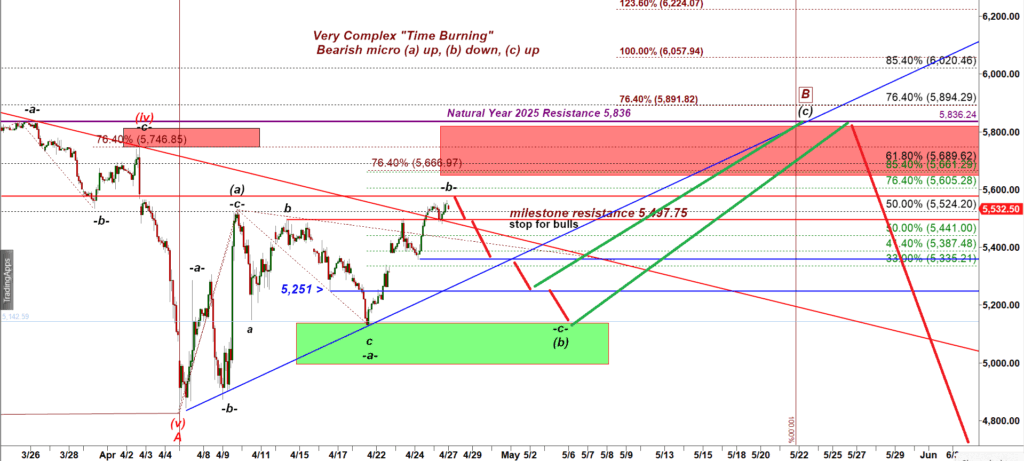
ES-mini 120 min chart
Let’s talk where this slow grinding move up can stop.
My main tool in forecasting potential revresal zones are extensions.
There are three types of extensions I use.
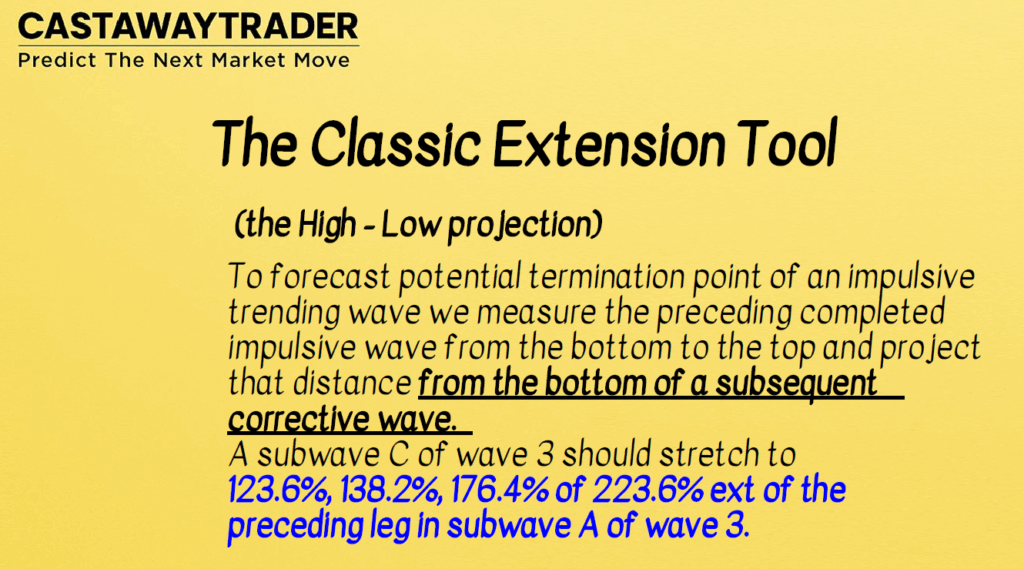
- The Classic Textbook ones (used by millions of traders):
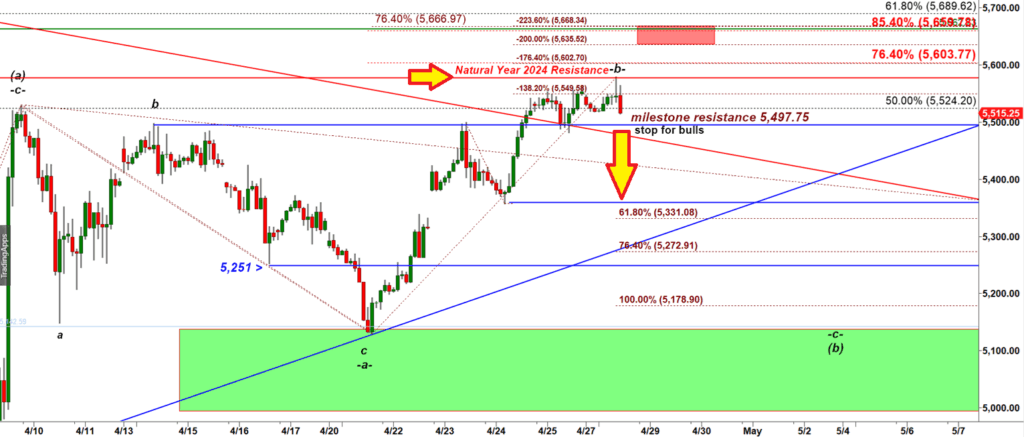
On the chart below you can see that I measured the blue wave up and projected it from the bottom of the red wave down:
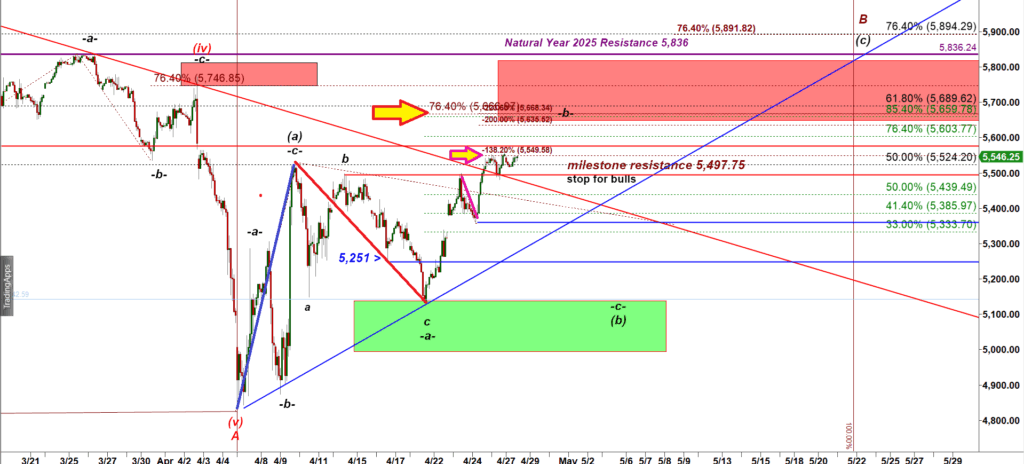
ES-mini 120 min chart
The minimum required target for a weak wave (c) up is a 76.4% ext = 5,667.
Type 2. A Modern Negative extension tool (used by 0.01% of traders).
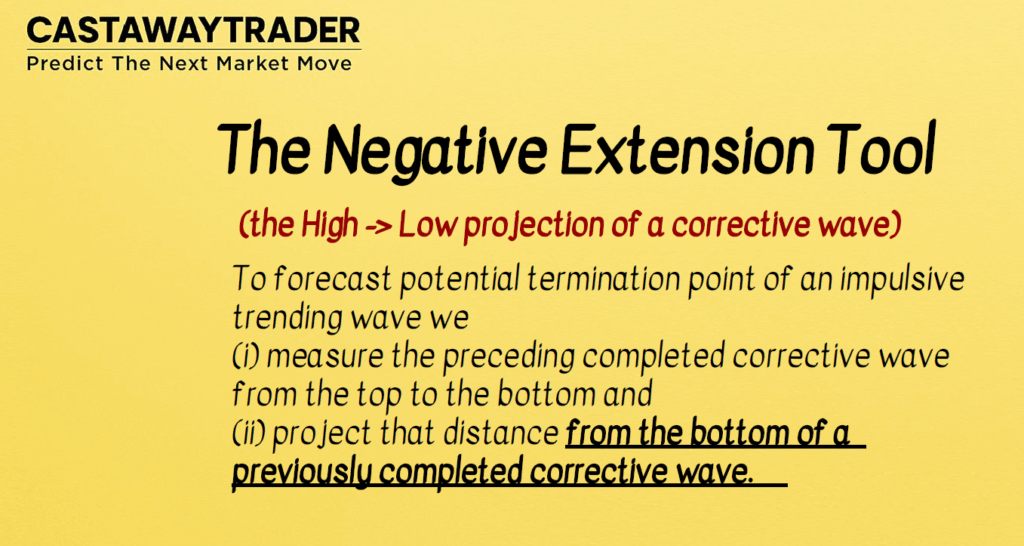
I measured the decline highlighted with the pink line and projected that distance off the bottom of that pink light:
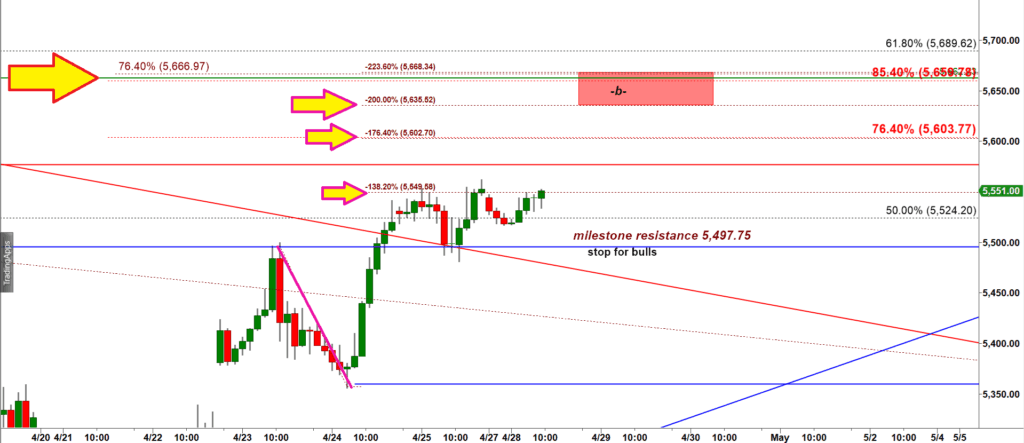
ES-min 120 min chart
The negative -138.2% ext points to 5,549.50.
ES has hit that level three times already!
The rule is a corrective wave has to stop at a negative -138.2% ext of the preceding decline.
 If price breaks over that level 5,550 the next target will be a negative – 176.4% ext of that same pink decline: 6,602.
Today I will post four new video lessons for two my video courses explaining how I use the classic and modern type of extension tools.
The Course 1: Predict the Market with Harmonic Elliott Wave Analysis
The Course 2: Trading Harmonic Elliott Waves like a PRO.
Very important announcement for subscribers!
I have created a channel CastAwayTrader in Telegram.
I will be posting notifications there as soon as I post an update on my web site.
I recommend you installing the Telegram messenger on your smartphone or/and desktop and setting notifications for posts published in my Channel to be able to get notified when I post new posts and intraday updates.
Link: t.me/TheCastAwayTrader
MIDDAY UPDATE posted at 11-31 AM
ES-mini 120 min chart
Yesterday I noted that the slow grinding move up may top at 5,586.50 (hitting the resistance inherited from the Natural Year opening range of 2024).
There are two key resistance levels:
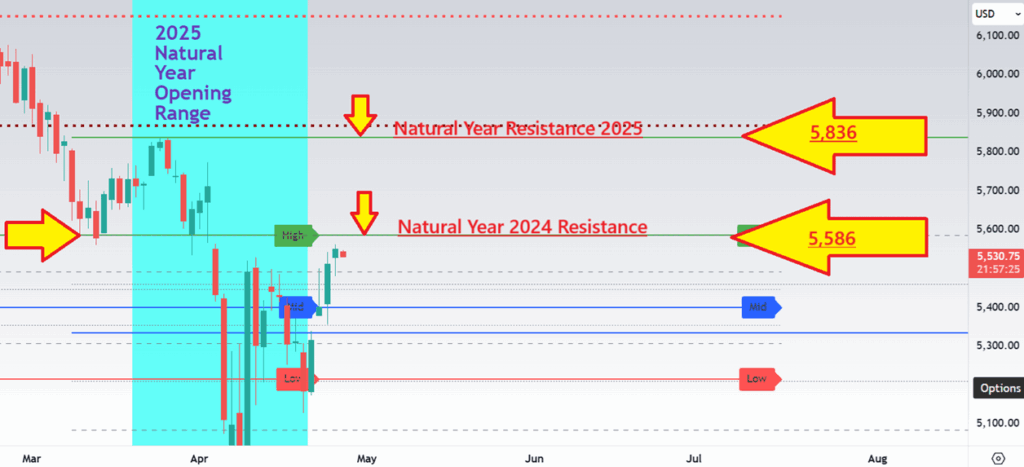
Let me remind you about the Natural Year Opening range
…“The Natural Year in the Northern Hemisphere begins with the vernal equinox (March 19/20, ‘24). The first month of the Natural year ends on April 19 The trading range created during that first month of the natural year will set important levels of support and resistance for the following 11 months”.
CONCLUSION: Break under 5,497.75 would confirm that scenario and open the door for a drop down to 5,331.