$ES #ES-mini #trading setup #Elliott Wave
Interestingly we get a similar picture on a macro and a micro timeframes. We got bearish Head and Shoulders pattern both, on a 240 min chart and on a tick bar chart:
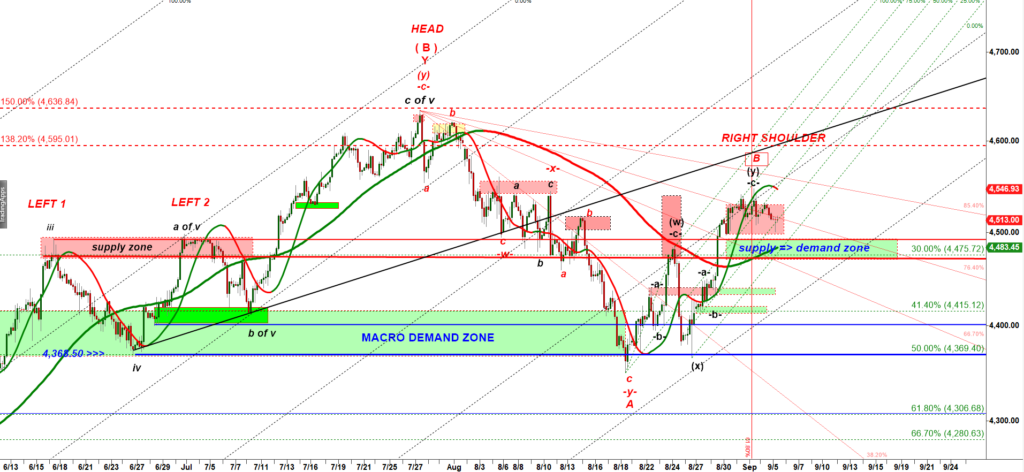
Note that on a macro 240 min chart ES is sitting over the supply zone that turned into a demand zone 4,494 – 4,466. That essentially means that if ES drops down one more time (as per the micro w-x-y down structure discussed above) it will complete a corrective structure right into the green Demand Zone on the 240 min macro chart. That would create a long setup for bulls.
Now let’s look at a micro tick bar chart:
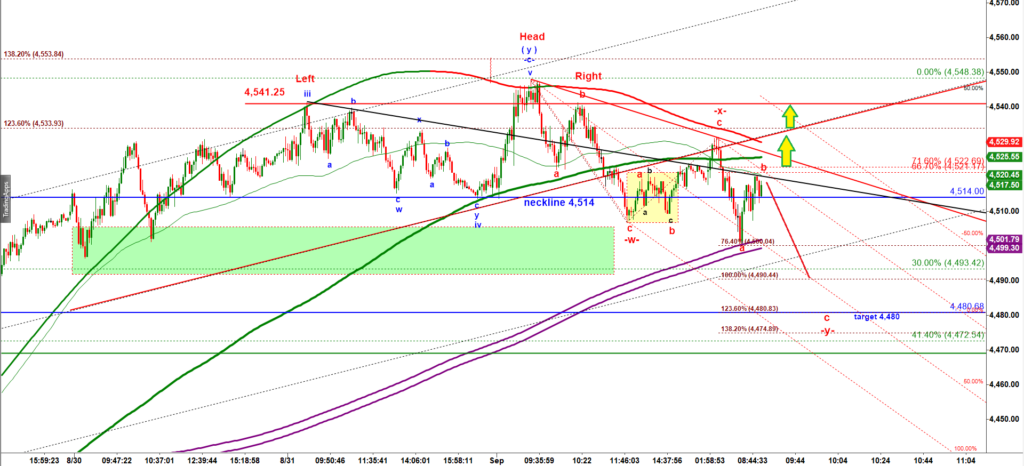
That strong pre-market recovery does not look encouraging for bears. A new lower low made during Monday pre-market trading session followed by a strong recovery is how the market often makes lows in corrective pullbacks. At best we can consider the move down off the top as a corrective Double Three -w-x-y- structure. To complete that structure we need to get one more push down in a subwave c of wave -y- down making a lower low under 4,500.
The key support for Tuesday is 4,512.75. To regain control bears need to push ES under 4,512.75.
If bulls manage to push ES over 4,523 that bearish count would start looking questionable.