$ES #ES-mini #trading setup #Elliott Wave
Bulls produced a rally but that rally stopped at a much lower level than I expected:
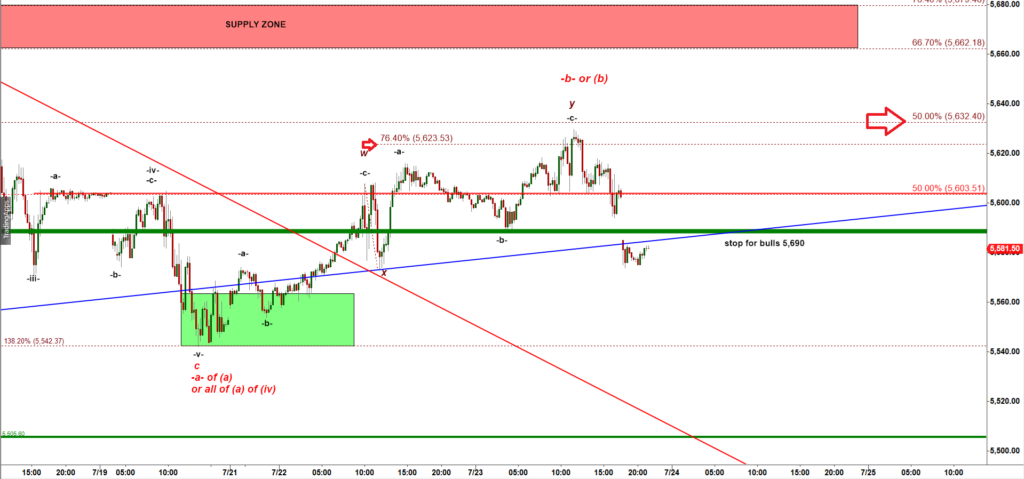
The primary wave count argues that the move up stopped at 50% retracement as a corrective w-x-y up structure. The second leg up in the wave y up stopped at the very minimum 76.4% ext of the wave w up. Normally the second leg up stretches to 123.6% or 138.2% ext of the second leg up. That fact makes me consider an alternative bullish scenario that allows bulls to try to test the Red Supply zone one more time. We will talk about that alternative bullish wave count in a minute.
But first I will show you a bigger picture that assumes the wave -b- up has topped:
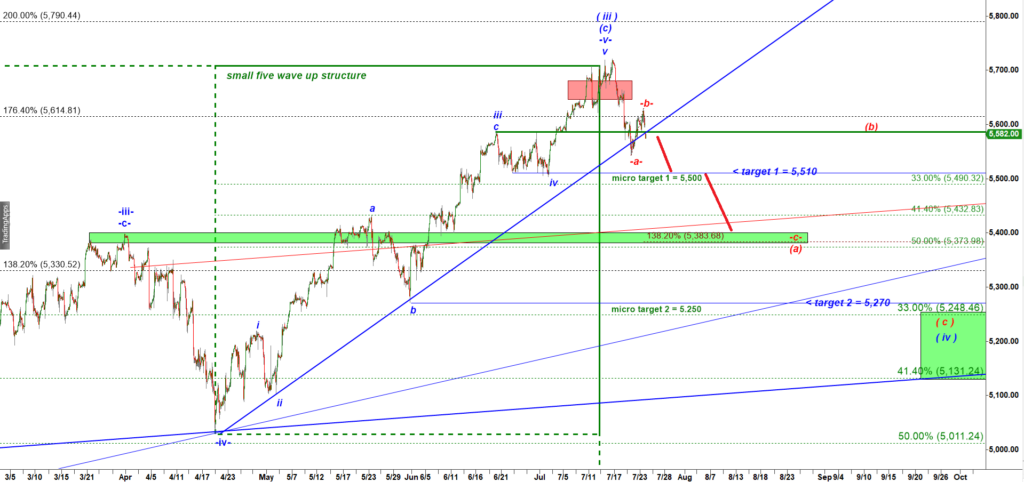
The primary bearish count allows bears to attack the support at 5,500.
Now let’s discuss the alternative micro bullish wave count:
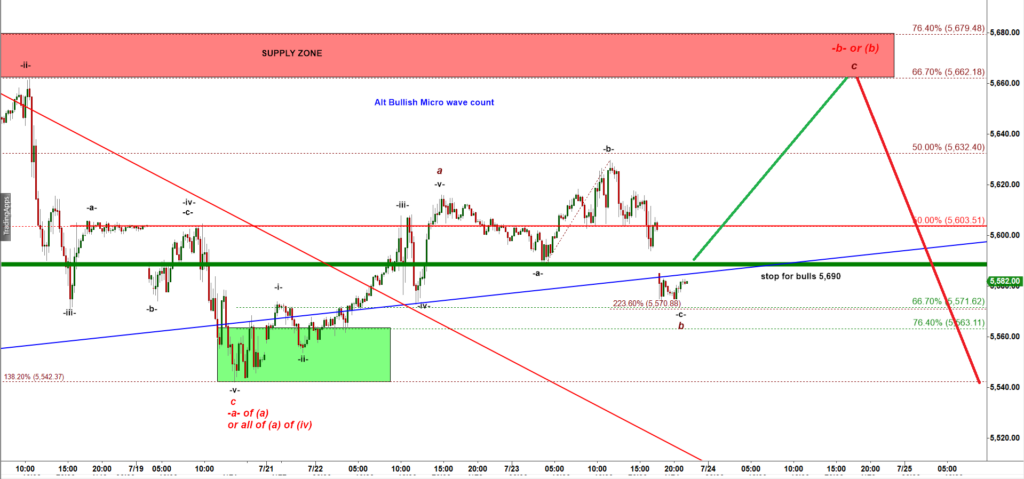
If bulls manage to reclaim the broken support 5,690, they will be able to produce a rally in a subwave c up targeting the Red Supply zone.
Again, what makes me consider that super tricky scenario is the fact that the second leg up stopped today at the very minimum 76.4% ext. That shortened leg up looks like a failed attempt to rally, a wave b up, rather than a legit leg up in a wave c…
Break under 5,570 will invalidate that alternative bullish scenario and would open the door for decline down to 5,500.