$ES #ES-mini #Elliott Wave #trading setup
5,721 was a very very strong resistance that now should work as a strong support:
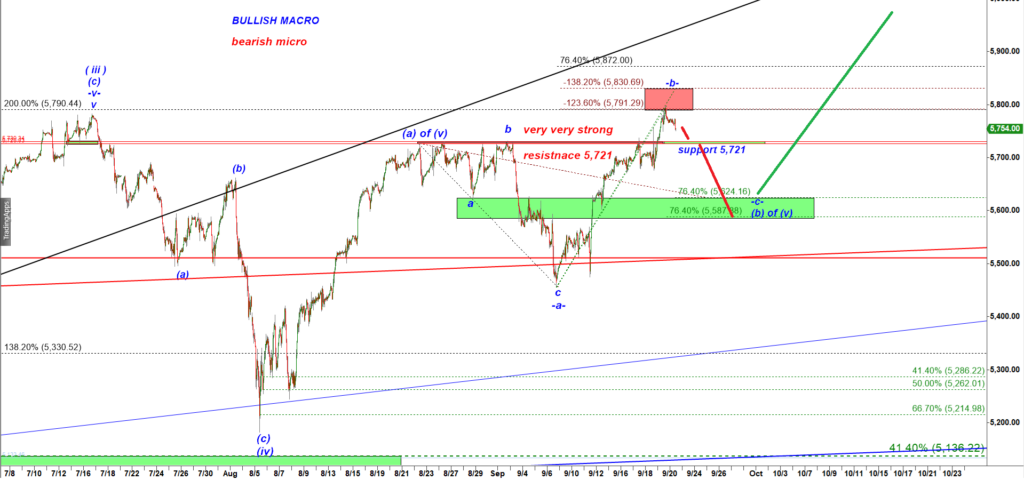
ES-mini 60 min chart
ES shows bearish reaction to test of the negative -123.6% extension (5,7921.25, a negative -123.6% ext) applied to the the preceding decline labelled -a- down. The -123.6% ext is not as stromg as a negative -138.2% ext (the upper edge of the Red Box). Therefore, quite often the first bearish reaction off the -123.6% ext (the lower edge of the Red Box) is followed by another push higher up to the negative -138.2% ext (the upper edge of the Red Box).
ES made a five wave up looking move off the last low made in early Sep’24. Its possible that it was a corrective subwave b up that mimicked an impulsive structure. That bearish scenario argues for a strong drop down to the Green box either from here or after another push higher testing the upper edge of the Red Box. That bearish scenario will be valid as long as bears hold ES under 5,830, the upped edge of the Red Box.
5,721 that used to be a very strong resistance should now work as a support. If bears fail to break under that support we should get another push higher to test 5,830.
(2) An alternative Bullish scenario:
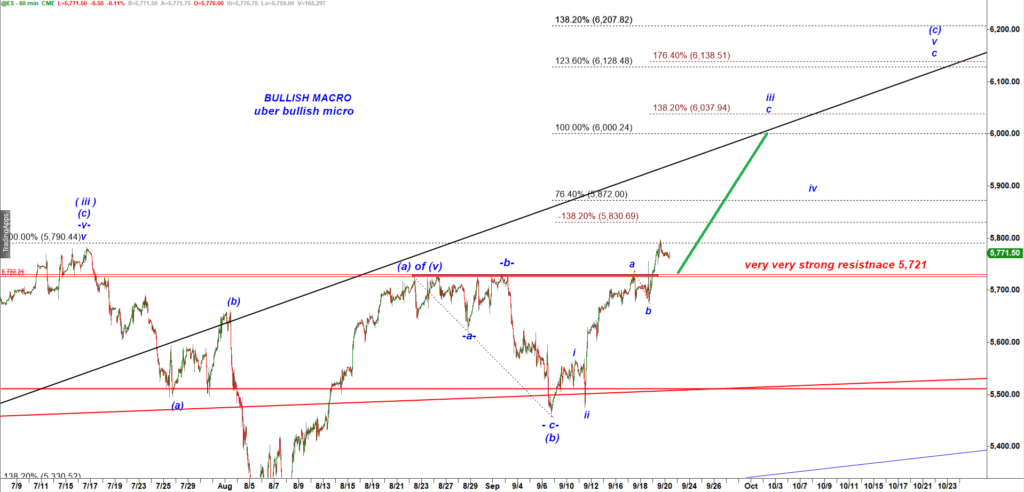
Es-mini 60 min chart
An alternative Uber Bullish count allows bulls to keep pushing ES up to 6,000.