$ES #ES #tradig setup #Elliott Wave
On Monday we discussed two macro bullish scenarios:
Es-mini Daily chart
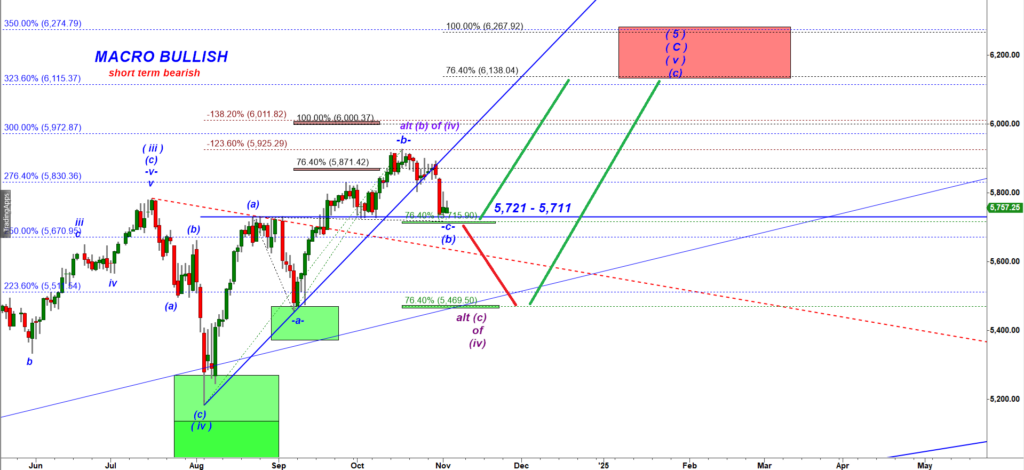
Back then I noted: “5,715 is a very important support because this is where a drop can complete a subwave -c- of wave (b) down. That bullish wave count allows bulls to start another leg up to the Red Box.“
Bears could not break under that crucial 5,721-5,711 support (the upper green box).
We can count ES-mini as having completed a corrective subwave (b) down of wave (v) up. That -a- down, -b- up, -c- down structure where subwave -c- bottomed at 76.4% ext of the subwave -a- is the most bullish corrective Running Flat structure we have in our tool box. That completed -a-b-c- down structure allows bulls to produce the final leg up targeting the Red Box.
There are two micro resistance levels.
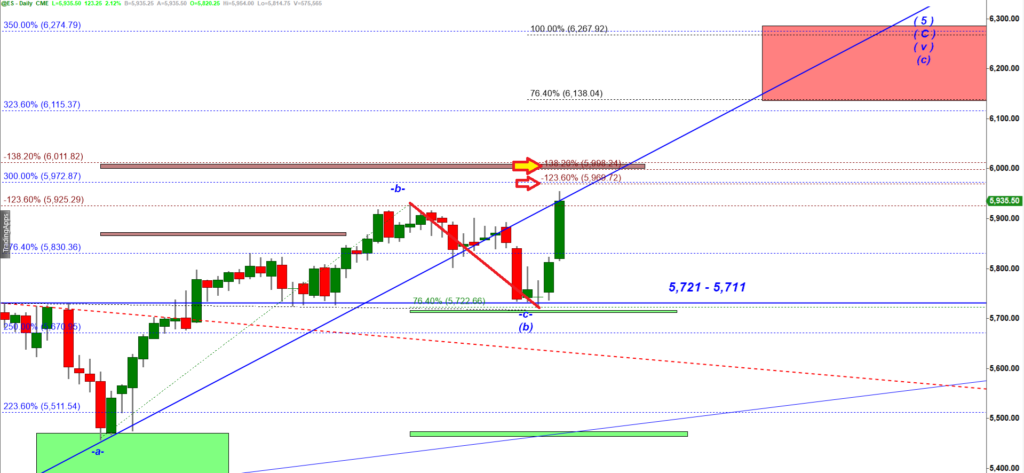
Let’s measure the recently completed pullback so we can use that pullback as a new starting point for adding a new negative extension as a target for the rally:
ES-mini Daily chart
The micro resistance 1 = 5,968.75 (a negative -123.6% extension), and
The micro resistance 2 = 6,008.25 (a negative -138.2% extension).
Note that the resistance 2 creates a tight cluster with the previously projected negative 138.2% ext off the July decline (6,011).
That level seems to be a strong micro resistance.
But the minimum target for this rally is the Red Box. Therefore we can expect only a pullback/consolidation off the 6,011 level.