$Es #ES-mini #Elliott Wave #tradinhg setup
Ther are two macro paths leading to the Red Box:
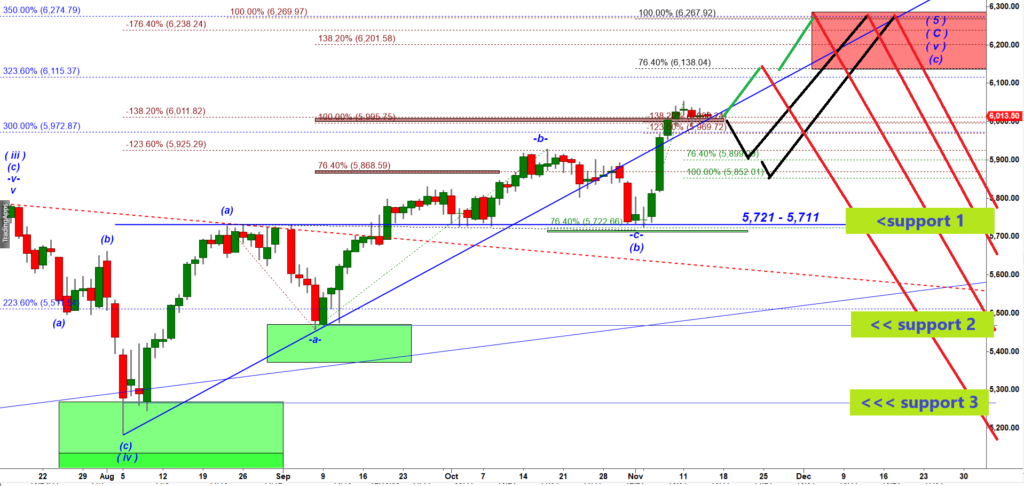
ES-mini Daily chart
The straightforward one is the green path. Note that bulls managed to overshoot a psychologically strong level of resistance 6,000. When price overshoots strong round levels it almost always comes back down to re-test that level from above. This is exactly what we see here. let’s zoom in:
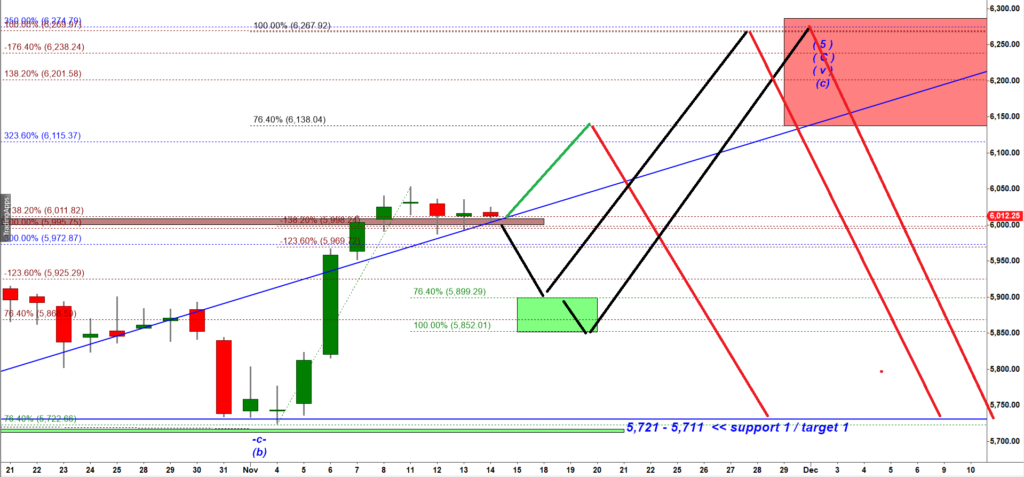
ES-mini Daily chart
Today we are getting the second inside day, a range bound day with a narrow trading range withing the range of Monday. That is a healthy bullish looking consolidation.
If bulls manage to defend 6,000 level they will be able to start another potentially final push up to the Red Box. A more tricky and painful scenario is the black one. Break under 6,000 would be followed by a quick drop down to 5,900 with potential extension down to 5,852 (the lower edge of the Green Box). What I like in that scenario is that a drop down to the Green Box would complete the Right shoulder of a bullish reversal Inverse Head and Shoulders scenario.
recently I published my new indicator for Tradingview called Trend Targets Map.
Last week we got three buy signals (see green arrows):
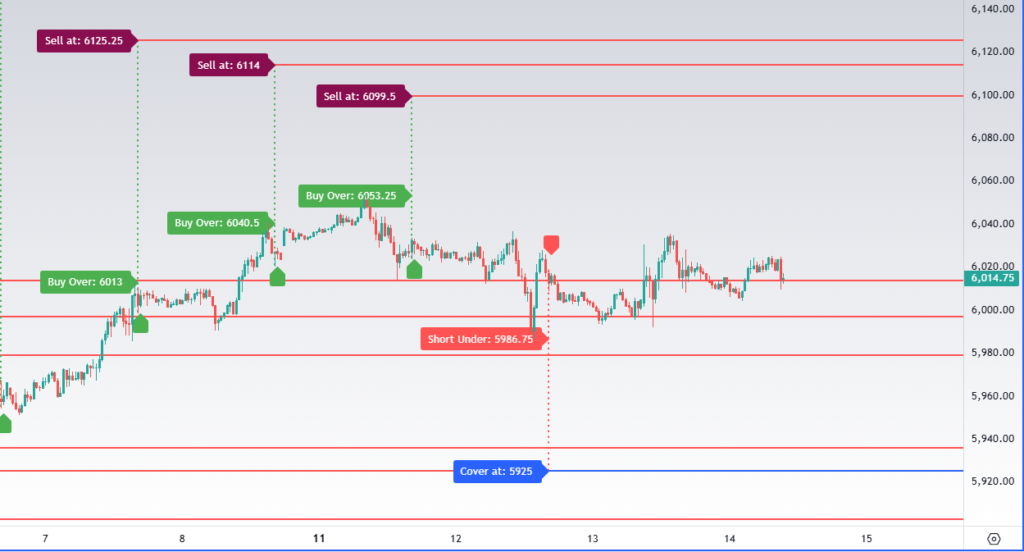
Each of those buy signals initiated sell targets (see the dark red arrows and red lines). So far ES-mini had not tagged them. On Tuesday ES produced a SELL signal and initiated target 5,925 (see the blue colored label and a line).