$ES #ES-mini #Elliott Wave #trading setup
Bears pushed ES-min down to the Green Box following the black path we discussed last week:
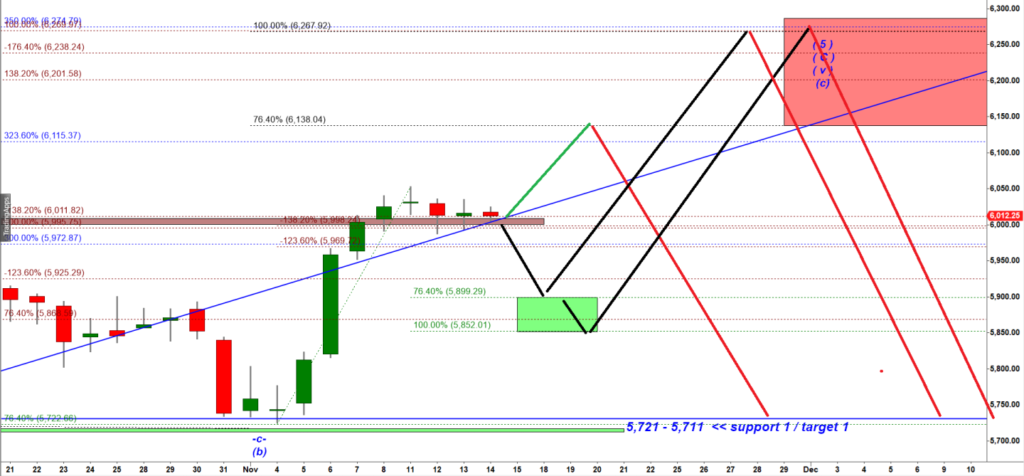
ES-mini Daily chart
This s how that chart looks like this morning:
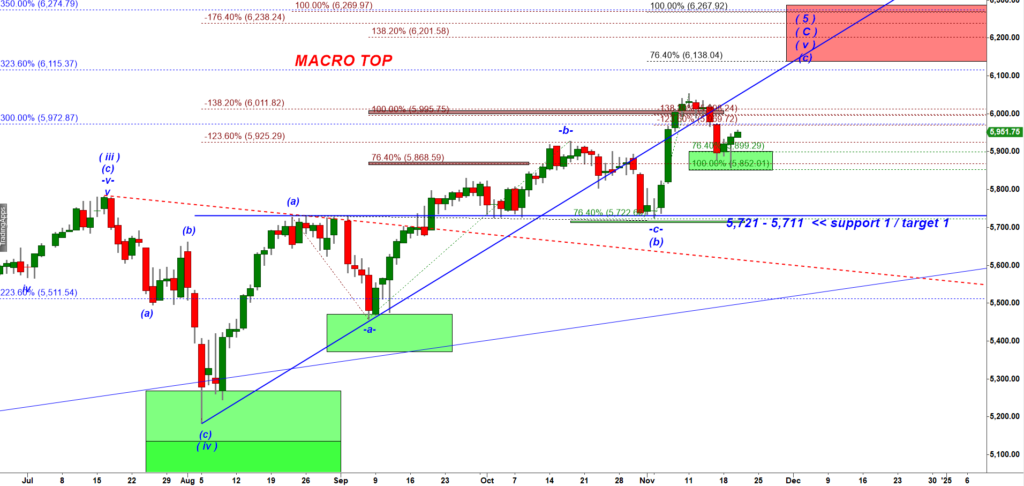
ES-mini Daily chart
Bulls produced a three day bounce off support of the Green Box.
Bulls have their eyes on the bullish black path showing the way from here up to the Red Box.
The problem is that the depth of the move down we got last week makes it very difficult for me to find a micro wave count that would allow bulls to push ES to a higher high and tag the Red Box.
Based on a bearish micro wave count I can argue that ES-mini has topped already:
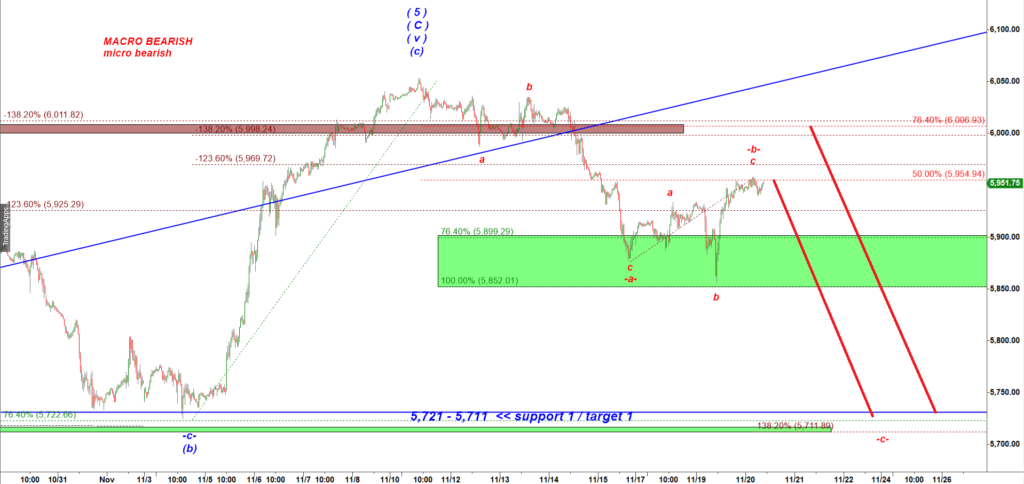
ES-mini 30 min chart
That micro wave count argues that ES has made a major top and the move down we got last week was the very first micro a-b-c move down that should be followed by another leg down in a subwave -c- down targeting 5,721.
Note that ES bounced up in a corrective looking three wave up move to a 50% retracement of the first a-b-c move down = 5,955). In the most extreme case bulls can push ES up to 6,000 (a 76.4% retracement of the preceding decline).
Upon completion of that three wave bounce I would expect bears to push ES down to the support 5,721 – 5,711.
To invalidate that bearish scenario bulls need to push ES over 6,000 ( a 76.4% retracement).