$ES $NQ #Elliott Wave #trading setup
I count the low made by ES-mini in Aug 2024 as the bottom of the wave (iv) down:
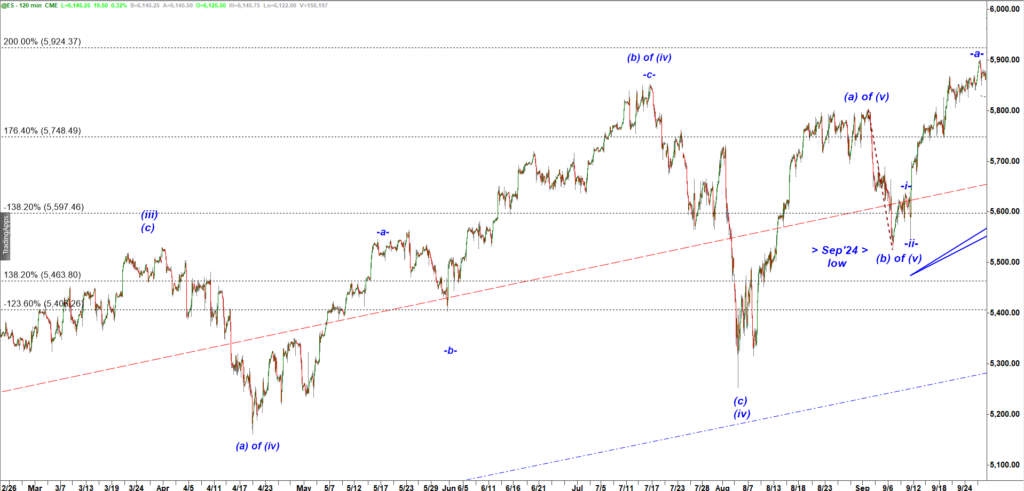
ES-mini 120 min chart
Then off the last low made in Aug 2024 we should get the final (a) up, (b) down, (c) up structure of the final wave (v) up:
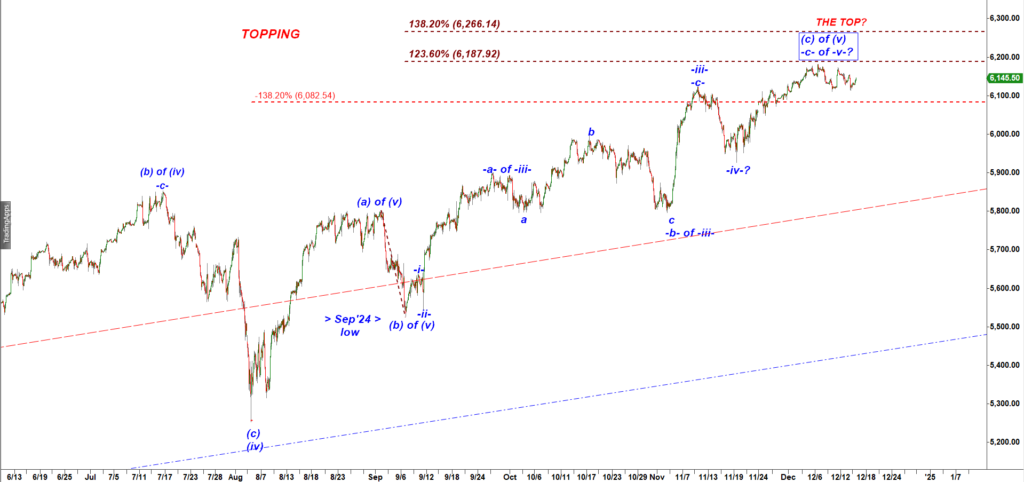
Es-mini 120 min chart
I can argue ES-mini has made that (a) up, (b) down, and (c) up subwaves of the final wave (v) up.
Now let’s have a look at NQ-mini:
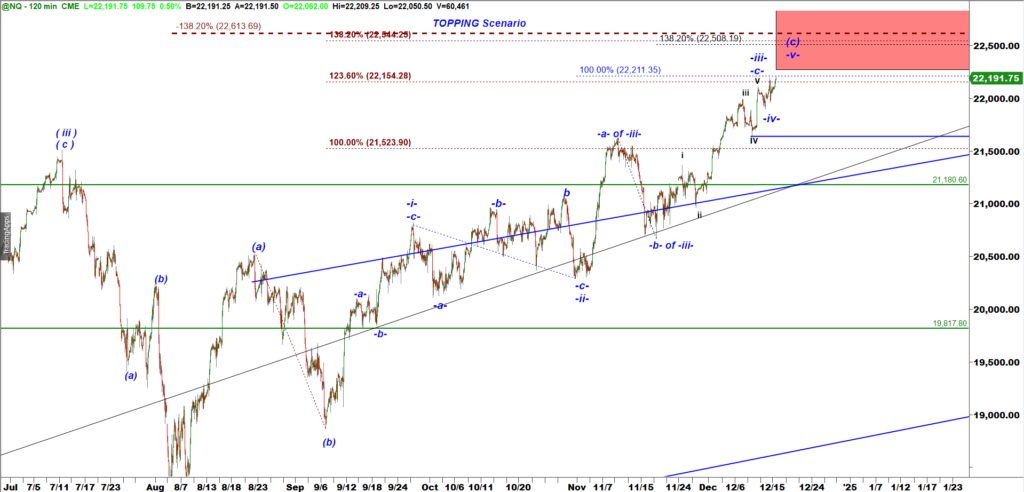
NQ-mini 120 min chart
NQ has a similar topping wave count. According t that count, it is approaching the Red Box and it has made enough micro squiggles to be considered as 99% done.
Upon completion of the wave (v) up we normally expect a bearish corrective (a)-(b)-(c) move down that normally finds support at the low made by the previous pullback in subwave (b) down of the wave (v) up. That is the Sep 2024 low.