$ES #ES-mini #Elliott Wave #trading setup
Bears are still in control. But they have to keep ES-min under the key resistance 6,107.50.
Let me explain why:
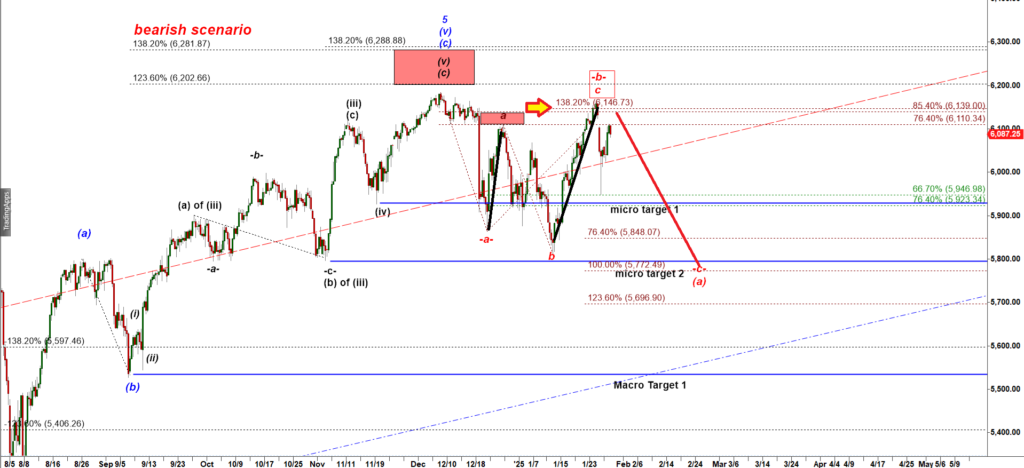
ES-mini 8 hour chart
You can see two legs p highlighted with black lines.
This is a corrective a up, b down, c up zig – zag pattern.
Note that they are connected by another a-b-c shaped move down labelled “b” down.
Yes, it managed to make a lower low under the starting point of the first black line labelled a up.
Then the second leg up labelled c of -b- managed to make a higher high over the top of the first black leg up.
This is a very tricky Expanding Flat corrective structure.
It sets up two traps, first for bears, when it undercuts the low made by wave -a- down and then when it overshoots the top made by a subwave a up of wave -b- down.
The previous top made by the first black leg up now turns into a critical support.
Indeed, a broken resistance always turns into a support.
6,107.50 is the key resistance now.