$ES #ES-mini #Elliott Wave
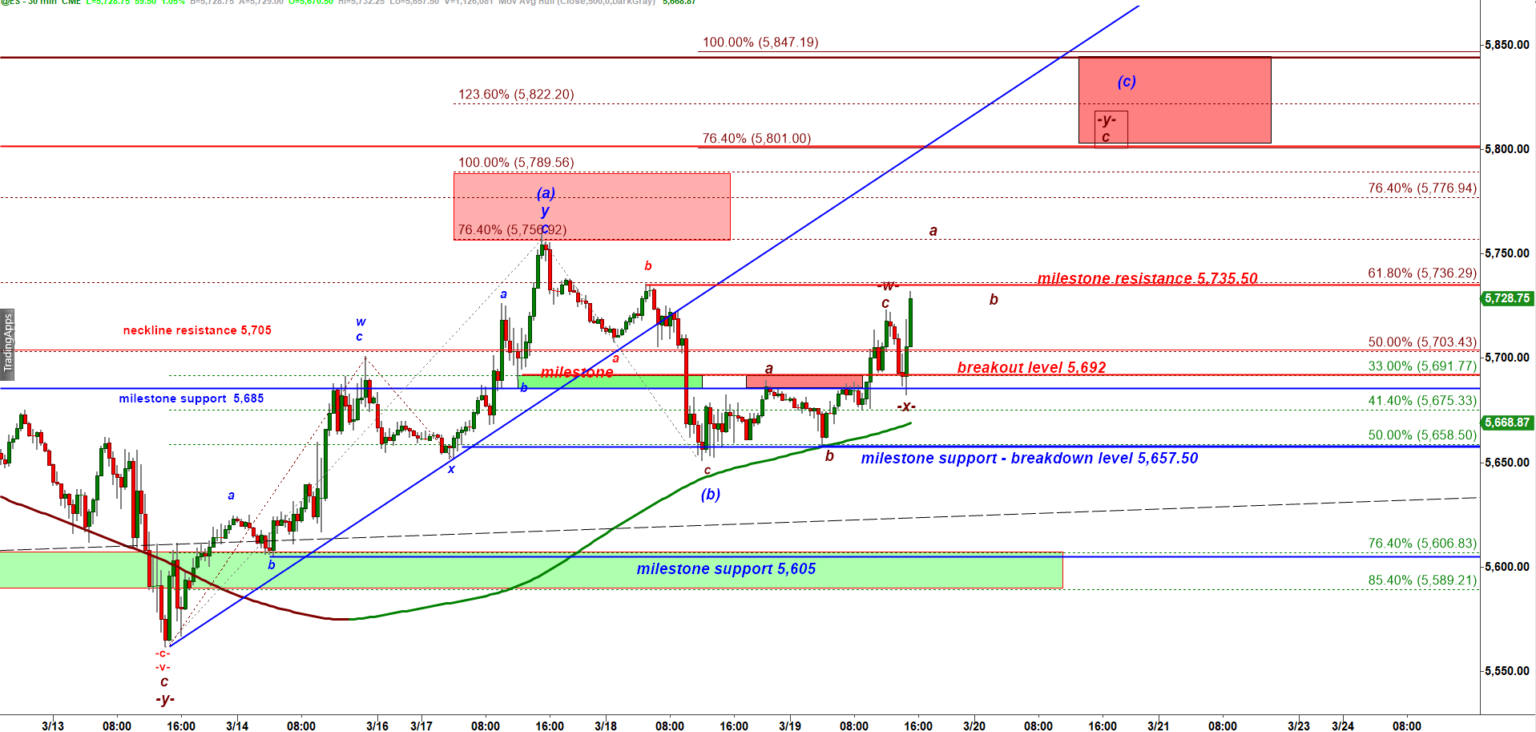
Yesterday afternoon I shared expectation for another push higher towards 5,800. And then ES rallied but stopped at 5,770. That was a good move but smaller than I expected.
ES refused to take the easy route (see the path I expected here, as it often does. The w-x-y upward structure could have completed if bulls had pushed ES to a higher high and tag the Red Box. However, that did not happen.
When your wave count gets invalidated, the immediate step is to zoom out and analyze the bigger picture. The goal is to regain orientation and determine the most likely next move.
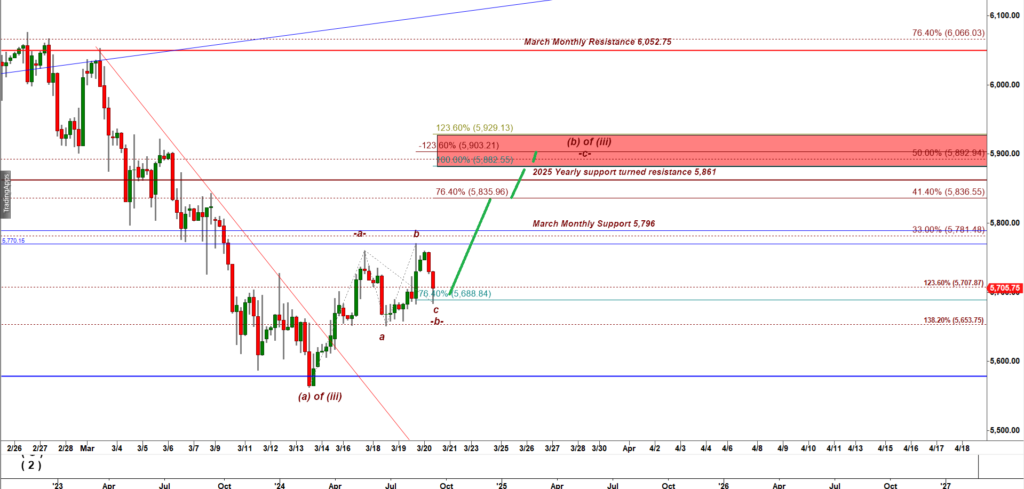
ES-mini 240 min chart
On the 240-minute chart, the post-FOMC push appears to be a subwave b up within a bullish Running Flat structure.
In a Running Flat:
- Subwave b up extends beyond the prior high.
- Subwave c down follows, forming a higher low.
According to this structure, the textbook target/support for subwave c of wave -b- down is at the 76.4% extension of subwave a down.
In this case, that support level is at 5,689—precisely where ES found support.
That wave count allows bulls to produce another rally targeting 5,861, a broken Yearly Support.
The micro resistance 1 = 5,836. That bullish setup will be valid as long as bulls hold ES over 5,689!
MORNING UPDATE at 10-46 AM EST.
ES-mini keeps rallying as we expected:
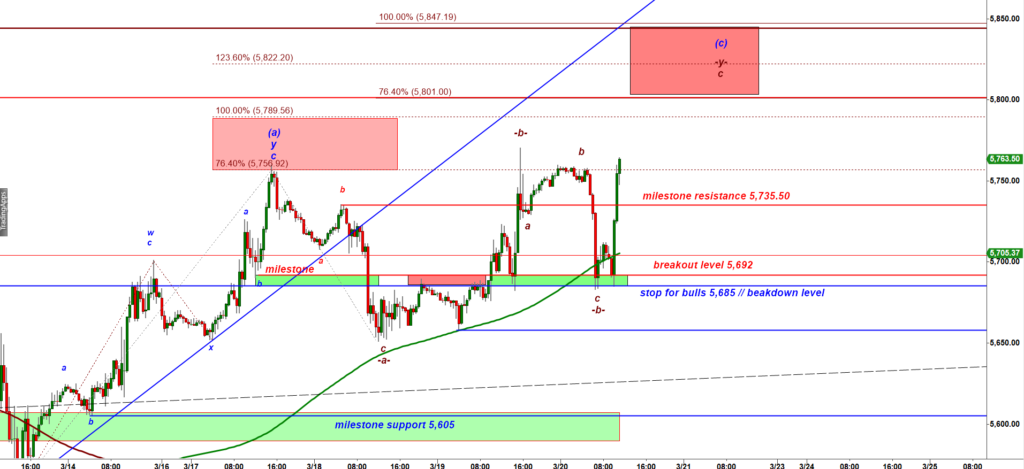
ES-mini 30 min chart
The resistance 1 = 5,801.
The resistance 2 = 5,845.