#MACRO #Weekend $ES #Elliott Wave
Over the last 10 years, chances to make money on going long SPY on March 23rd and hold until mid April were 80%.
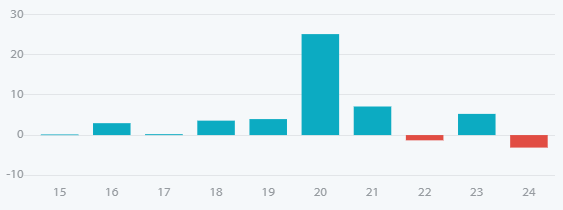
That seasonal trade did not work only in 2022 and 2024 years (see above).
BULLISH MACRO SCENARIO:
Bulls actually have a decent long setup to benefit from the bullish seasonality:

ES-mini 240 min chart
That wave count argue that a push up to 5,861, a strong level of resistance would complete the first (a)-(b)-(c) up move off the March low and that (a)-(b)-(c) up move would be only the wave ( i ) up from an impulsive five wave up rally we may get.
The mid Dec 2024 top may be counted as atop of a subwave (a) of wave (v) up:
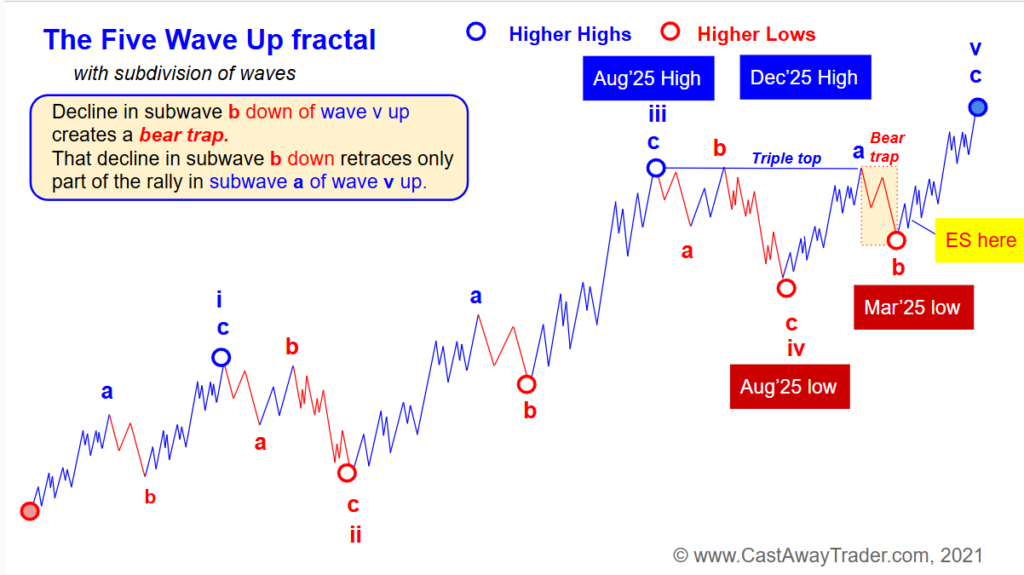
The Five Wave up fractal
The (a) down, (b) up, (c) down pullback that followed the mid Dec 2024 top looks like a textbook subwave (b) down of a wave (v) up.
The a-b-c down structure of the subwave (b) down of wave (v) up is normally concluded with a sharp panic driven subwave c of (b) down.
We know that in the vast majority of cases a wave 5 has to stretch to either a 76.4% or 100% extension of the progress made by waves 1 and 3 projected from the low of wave 4 down.

ES-mini 240 min chart
If we measure the rally from the Oct 2022 low to the Aug 2024 high and then project a 76.4% of that rally from the low made in Aug’24 we will get the normal target for the wave ( v ) up = 6,745.
The Dec 2024 top was made at 6,233 (ES continuous contract).
 **The rally from the Aug’24 low to the mid Dec 2024 was a way too small to be all of the wave ( v ) up. And that is the strongest card bulls hold here.
We can use extension tool to attempt predicting a potential target for a rally in a subwave (c) of wave ( v ) up.

ES-mini 240 min chart
I circled two extensions we got by projecting a rally in waves (i) and (iii) from the low of the wave (iv) down). I have added red arrows showing extensions of the subwave (a) of wave ( v ) up. And you immediately notice two clusters of targets:
The cluster 1 = 6,711 – 6,745, and
The cluster 2 = 7,189 – 7,200.
So, the bulls currently have a valid wave count that allows them to stage a rally. On top of that, they enjoy a powerful tailwind in the form of bullish seasonality over the next three weeks.
That presents an opportunity—but not a guarantee—that the rally will materialize.
The uncomfortable and often painful truth is that even a setup that looks bulletproof can sometimes fail. That’s why I always examine charts from multiple angles. I want to understand what cards the bears might be holding. What are their arguments? Do they have a wave count that supports pushing prices lower?
In the end, we don’t care which party wins.
Imagine you’re observing a poker table—not as a player, but as a spectator who can place bets on either of the two players sitting there. Better yet, you can see their cards.
And you’re free to leave at any moment. You’re not emotionally involved. You have nothing to prove. They’re playing against each other, and you’re just an invisible outsider, calmly watching from a distance. In fact, you can benefit the most when one of them gets emotional and loses control.
Those are the rare but best opportunities.
This is exactly why we always review both bullish and bearish wave counts—we want to see all the cards on the table.
Our goal is to identify whether one side has an overwhelming advantage in this game—because we only want to bet our money on a player with a clear edge.
BEARISH MACRO Scenario
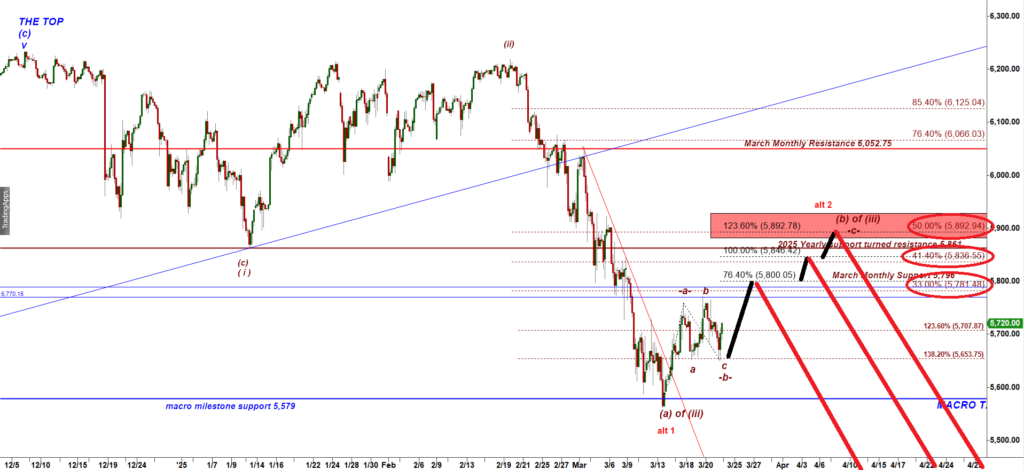
ES-mini 240 min chart
In the first part of this Weekend update I explained that the last push higher from Aug 2024 low to the high made in mid Dec 2024 was a very short one for the final wave ( v ) up. However, the stock market does not work ideally like Swiss watches all the time. From time to time there could be imperfect completion of big rallies and declines. Let’s assume bears are right when they claim ES-mini made a lasting top in Mid Dec 2024. In that bearish case the first textbook target for the first corrective drop is always the low made by the wav e(v) of one degree lower = 5,246.
ES-mini has not tagged that target yet. This is why bears may argue that the first leg down has NOT bottomed yet.
Here we apply our two mighty tools from our tool box.
Tool 1: we always look for a corrective -a-b-c- up bounce. I strongly recommend you reading this and this articles.
When we’re dealing with a corrective A-B-C upward bounce, we typically expect the second leg up—subwave C—to unfold as a strong short-covering rally. That leg often stretches to the 123.6% or 138.2% Fibonacci extension of subwave A.
In the case of a normal second leg up, wave C may stall at the 100% extension of subwave A, which is 5,846.
In the case of a strong second leg up, it can reach the 123.6% extension at 5,892.
When we suspect we’re in a corrective A-B-C upward move, we also apply Fibonacci retracements to the preceding decline. Key retracement levels to monitor include:
- 33.3% retracement = 5,781.50
- 41.4% retracement = 5,836.50
- 50% retracement = 5,893
By combining both Fibonacci extensions of subwave A and retracements of the preceding decline, we can define three potential resistance clusters where subwave C may terminate inside a corrective A-B-C bounce:
- Cluster 1: 5,781 – 5,800 — includes the 76.4% extension of subwave A, typically seen in a very weak subwave C.
- Cluster 2: 5,836 – 5,846 — aligns with the 100% extension and the 41.4% retracement.
- Cluster 3: 5,892 — a strong confluence zone at the 123.6% extension and the 50% retracement.
So, even under a bearish macro scenario, bulls may still have enough strength to push the ES-mini higher into one of those key resistance clusters.
If bulls fail to break through—ideally below 5,892—that would present a very attractive short setup. Why? Because a three-wave corrective bounce that reaches the 41.4% or 50% retracement is often followed by another powerful leg down: subwave (C) of wave (iii) down.
We refer to this part of the five-wave decline as the “heart of the selloff”—a relentless, accelerated move lower that doesn’t allow meaningful bullish pullbacks. Bulls who are late to exit their long positions are forced to sell into weakness, further intensifying the downside pressure.
Micro update:
Tonight ES-mini has gapped up and that totally fits both, the bullish and bearish scenarios:
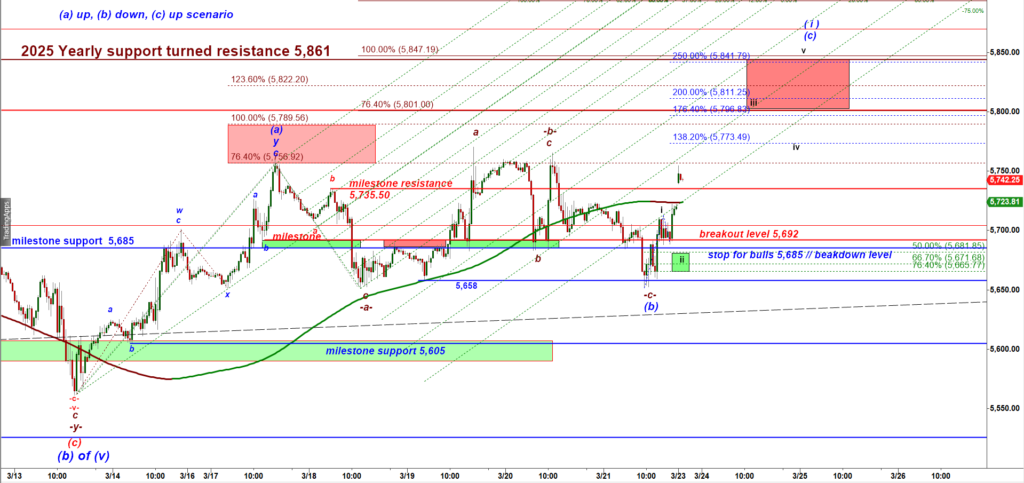
ES-mini 30 min chart
The ES-mini has gapped up, which aligns perfectly with the bullish scenario.
In both the bullish and bearish frameworks, we anticipate a classic (a) up – (b) down – (c) up corrective structure. At this point, we appear to be in the early stages of micro wave iii up within wave (c) up.
Currently, ES is testing a key level: the previously broken Monthly Support at 5,744, which now acts as a significant resistance.
If bulls manage to break and hold above 5,744, it would pave the way for a potential rally toward the next major resistance level: 5,861, which marks the broken Yearly Support.