$ES #ES-mini #Elliott Waves
As we expected in the Weekend Update posted on Sunday morning, a break back over the Monthly Support 5,744 was followed by extension of the rally:

ES-mini 30 min chart
There are two key levels of resistance ahead:
The 76.4% ext of the wave ( a ) up = 5,801 (the lower edge of the Red Box), and
The 100% ext of the wave ( a ) up = 5,847.
Yesterday we discussed potential resistance area where bears may stop that move up:

Bears still consider that rally as the second leg of a corrective (a) up, (b) down, (c) up corrective bounce:

ES-mini 30 min chart posted on Sunday, March 24, 2025
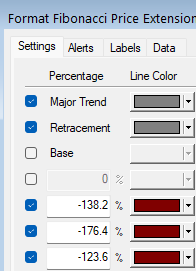
I will also be watching -123.65 and – 138.2% extensions of the previously completed wave (b) down:
Yesterday I explained:
…“When you expect a corrective wave B up you always focus on a 123.6% and 138.2% negative extensions. you measure the very last move down from the top to the bottom and you extend that distance from the bottom of that drop changing normal fibs like 123.6%, 176.4% and 176.45 BY ADDING MINUS in the settings. However, if you expect an impulsive rally like a subwave (c) of wave ( v ) up you should focus on -138.2%, – 176.4% and – 223.6% ext of the very last completed drop”.
In conclusion, bulls need to break over 5,861 with gusto to confirm the bullish scenario where this rally is only a wave ( i) up. Until that happens we should play defensive and cautiously consider that rally a corrective (a)-(b)-(c) up bounce that would be followed by another decline.