to prove it was more than just a corrective bounce off the mid March low…
$ES #ES-mini #ElliottWave #trading setup #forecast
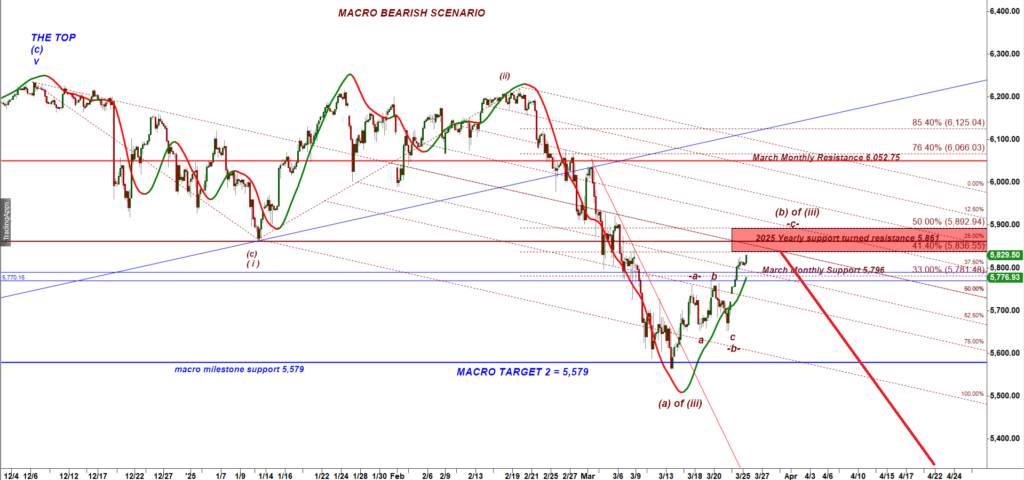
ES keeps crawling up and is approaching two strong resistance levels:
- a milestone resistance 5,843, and
- a broken Yearly Support-turned-resistance = 5,861.
Under the bearish scenario the whole a-b-c p bounce off the mid month low was a corrective subwave (b) up of wave ( iii ) down:
ES-mini 240 min chart
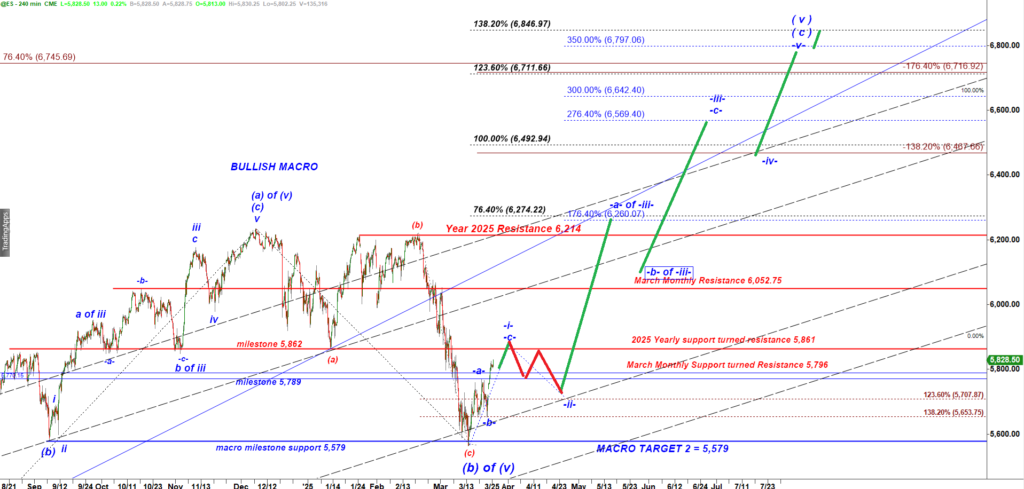
Bulls have a very different picture in mind. They consider that a-b-c move up off the loas a only a micro wave i up of a new impulsive five wave up rally targeting 6,700+.
I discussed different ways of projecting a target for that bullish scenario in my weekend update.
This is what bulls see here:
ES-mini 240 min chart
To confirm the bullish scenario bulls need to violate the key resistance 5,861. Most likely that breakout would be a short lived one and will be followed by a corrective a-b-c down pullback in a wave -ii- down. If that second leg up in a wave -c- up tops out UNDER 5,861 that would be a strong bearish sign in favor of the Macro Bearish scenario.
The next attractive setup is a short based on the textbook “failed breakout” setup. We need bulls to produce a spike over 5,843 followed by a drop back under that level.
If that setup does not work we will wait for that same “failed breakout” setup to form around the key 5,861 resistance.
The bearish reaction that should follow will tell us a lot about the real balance of powers between bulls and bears. A strong drop back down to 5,654 (a milestone micro support) would increase probability of the bearish scenario.