$ES #ES #Elliott Wave
Looking at the ES Mini chart, it’s hard to argue that the drop is complete.
The Sunday low likely marked the end of wave (iii) down.
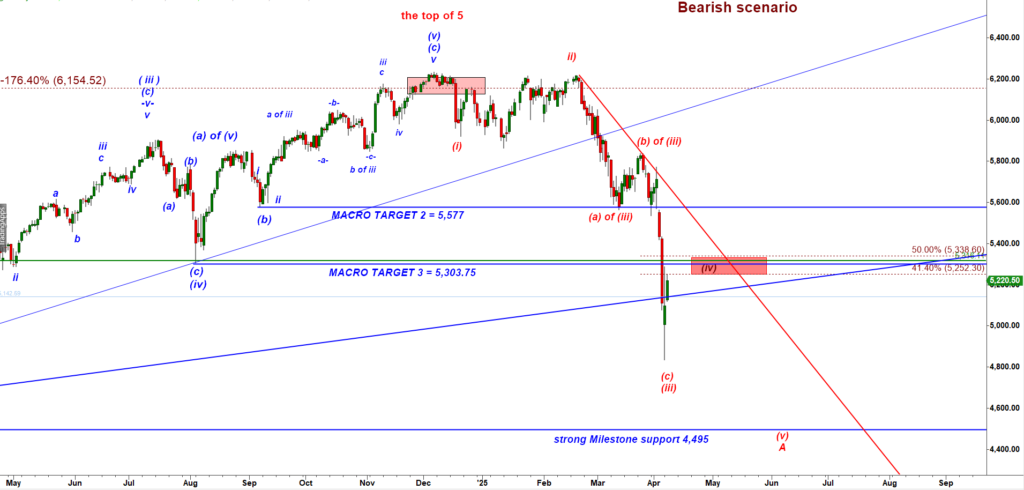
ES-mini Daily chart
The bounce from that point is now being counted as corrective wave (iv) up.
Key retracement levels to watch:
- 41.4% retracement = 5,252
- 50% retracement = 5,338
These are classic targets where wave (4) tends to top out.
🔍 Let’s zoom into the 15-min chart
Monday morning’s sharp spike formed a textbook three-wave bounce, which could have concluded a short squeeze rally. This setup should have triggered a new leg down in wave (v)—but the market didn’t deliver.
ES-mini 15 min chart
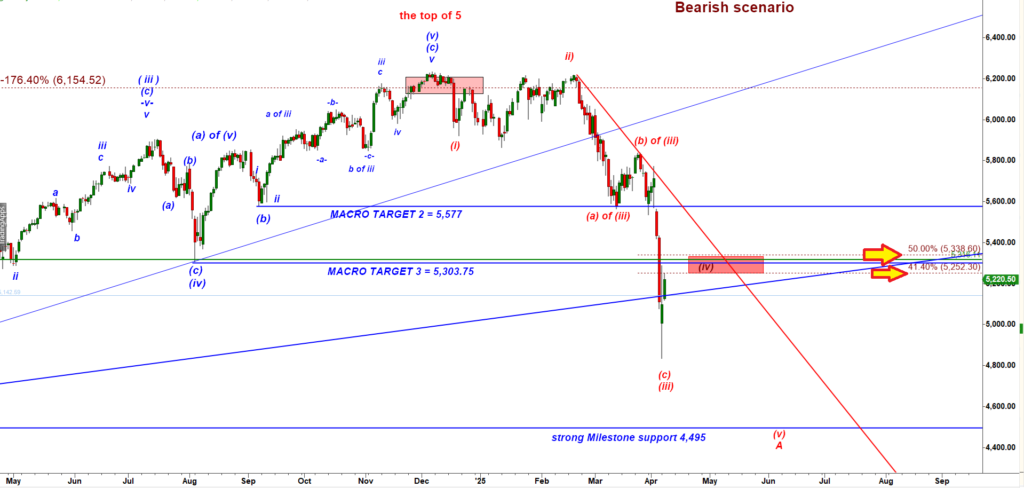
On the second chart you can see two red arrows pointing to the two key retracement levels to watch:
- 41.4% retracement = 5,252
- 50% retracement = 5,338
So we got a picture perfect a-b-c up bounce but a new leg down in a wave (v) down has not started. Instead we are watching a slow, grinding move upward (highlighted in the yellow box).
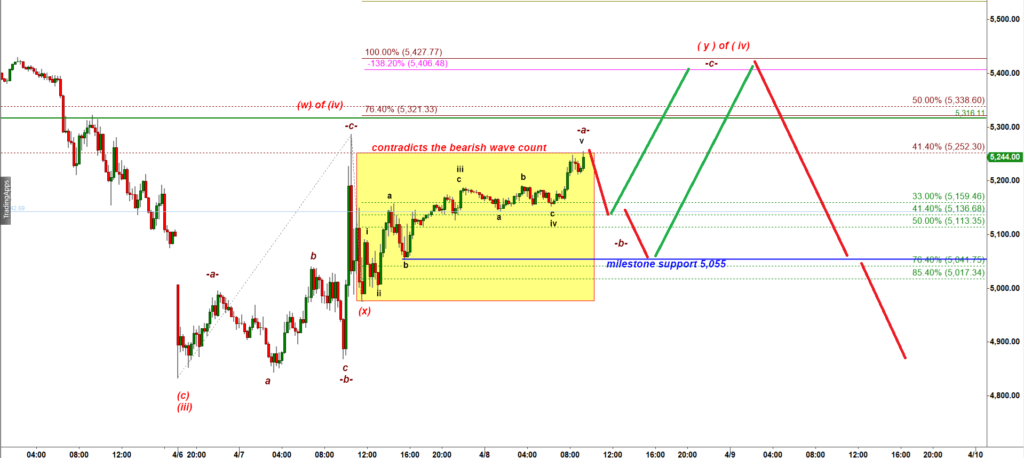
ES-mini 15 min chart
This kind of price action does not align with a bearish scenario that assumes the wave (iv) up has topped..
So there’s no urgency to short this move, as the wave count doesn’t currently support an immediate drop back to Sunday’s lows.
📌 Current Count Hypothesis:
The clean -a-b-c- move up from Sunday’s low, although it didn’t lead to a new decline, may represent the first leg in a complex corrective structure: (w) up, (x) down, (y) up—all part of wave (iv) up.
Inside the yellow box, the five-wave micro-structure is likely the subwave -a- of wave (y) up.
In conclusion, we can expect bulls to push ES-mini higher before they complete the corrective wave ( iv ) up.
MIDDAY update posted at 12:48 PM EST
Bears test the 50% retracement of the morning rally = 5,130.24.
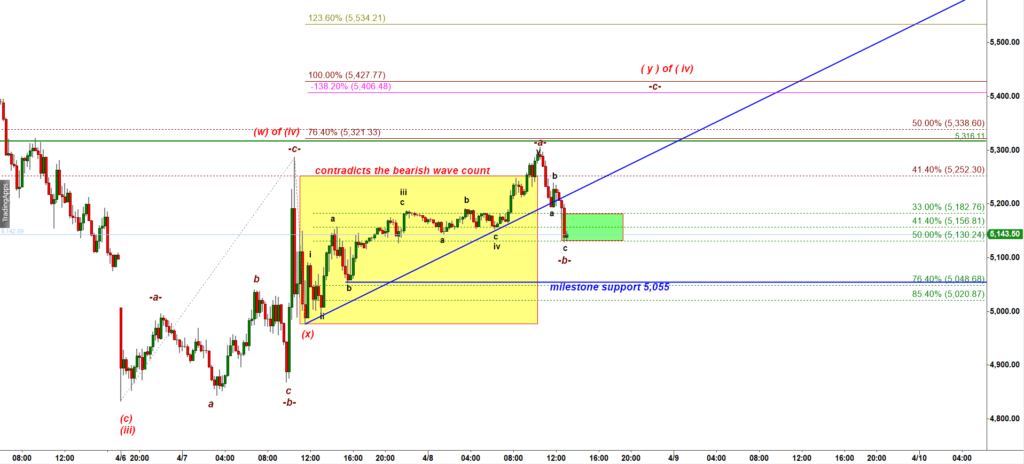
ES-mini 15 min chart
Bulls got a long setup for another leg up. That is a “make it a break it” moment of the day here.