$ES #ES-mini #Elliott Wave
As anticipated, sellers showed up right on cue in ES, turning price down from a powerful confluence zone — the 50% retracement Fib combined with the 138.2% extension Fib.
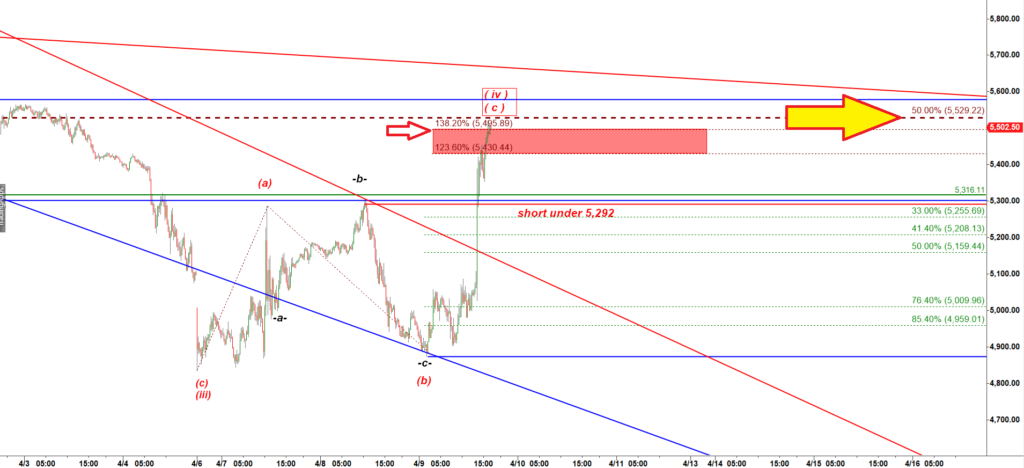
ES-mini chart posted at 4:34 PM on Wednesday
This is what I posted for subscribers of my chat room at 4:34 PM EST yesterday:

Where Are We Now?
It all comes down to how price reacts at key support — 5,292.
Yesterday’s rally stalled perfectly at the yearly pivot resistance:
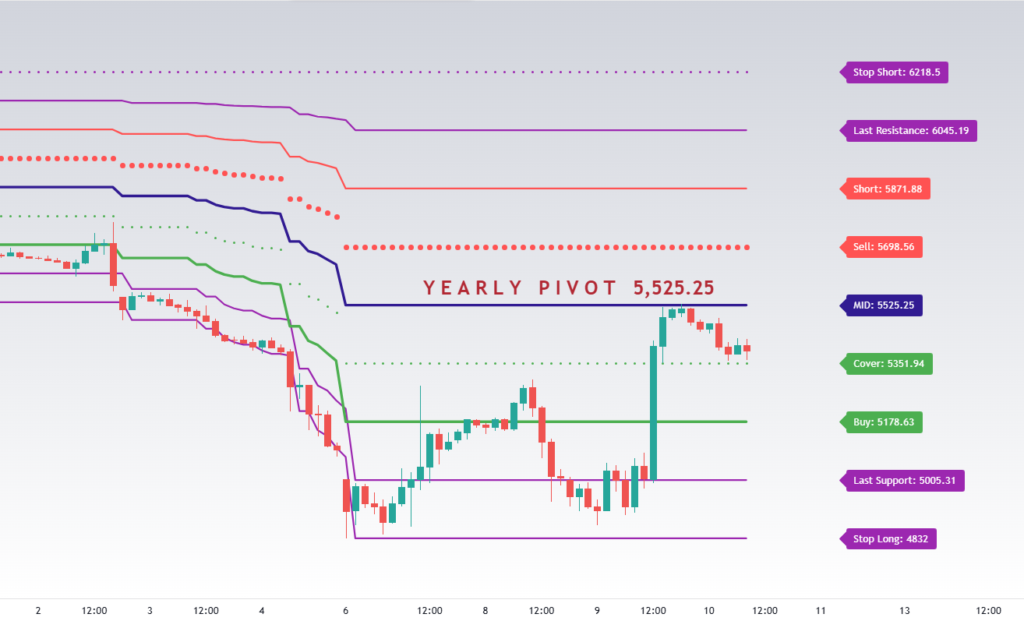
Now, bulls must defend the monthly pivot at 5,302.25:

Two Potential Scenarios + Two Trading Plans:
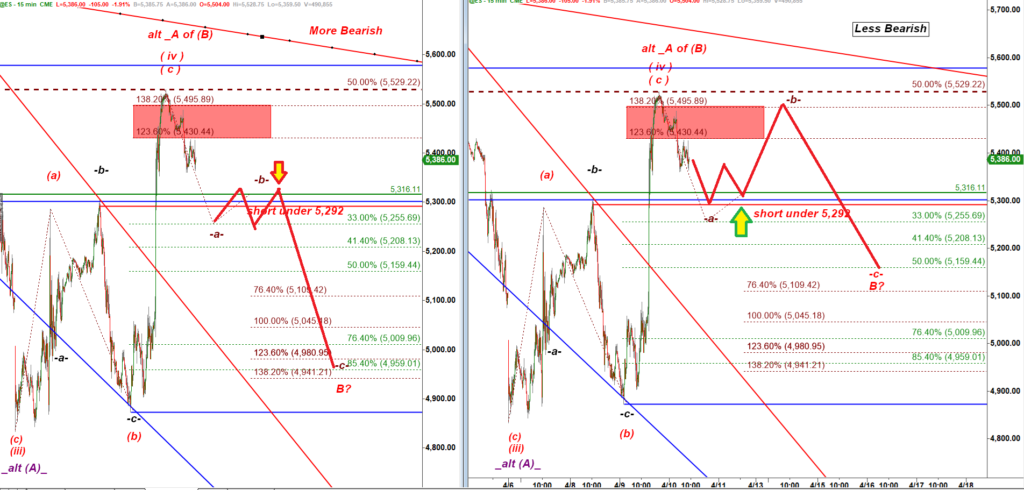
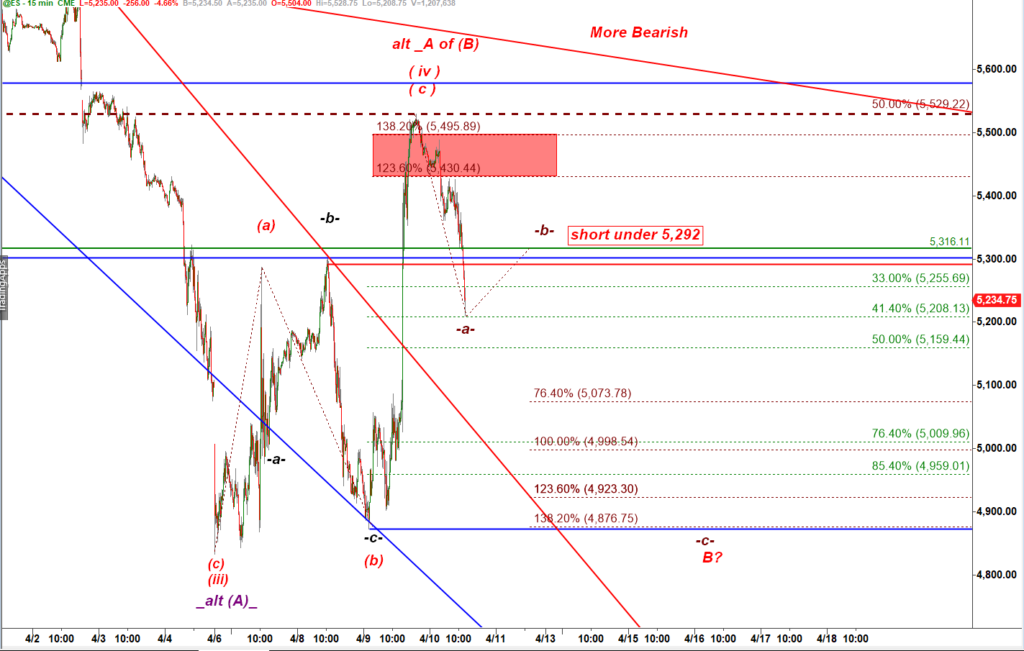
ES-mini 15 min chart
More Bearish Path (Left Chart)
- Price breaks down below 5,292.
- We get an a-b-c corrective bounce back up — retesting 5,292 from underneath.
- Then another 300-point drop — potentially all the way toward 5,000.
Less Bearish Path (Right Chart)
- Price dips into the 5,300 – 5,290 zone.
- Bulls manage to defend that area — just like earlier this week.
- Bulls manage to defend that area — just like earlier this week:
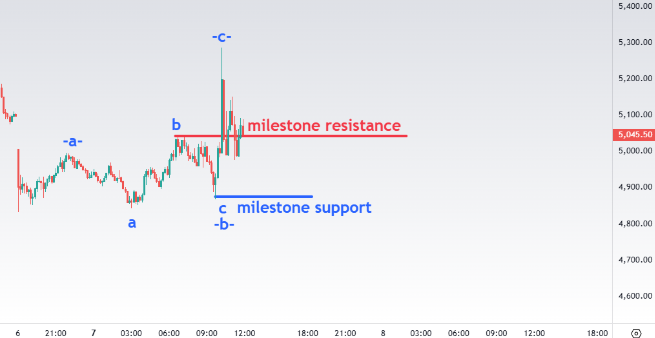
Tuesday, Apr 8 price action case study
If so, expect a slow, grinding rally back to Wednesday’s highs — similar to Tuesday morning’s move:
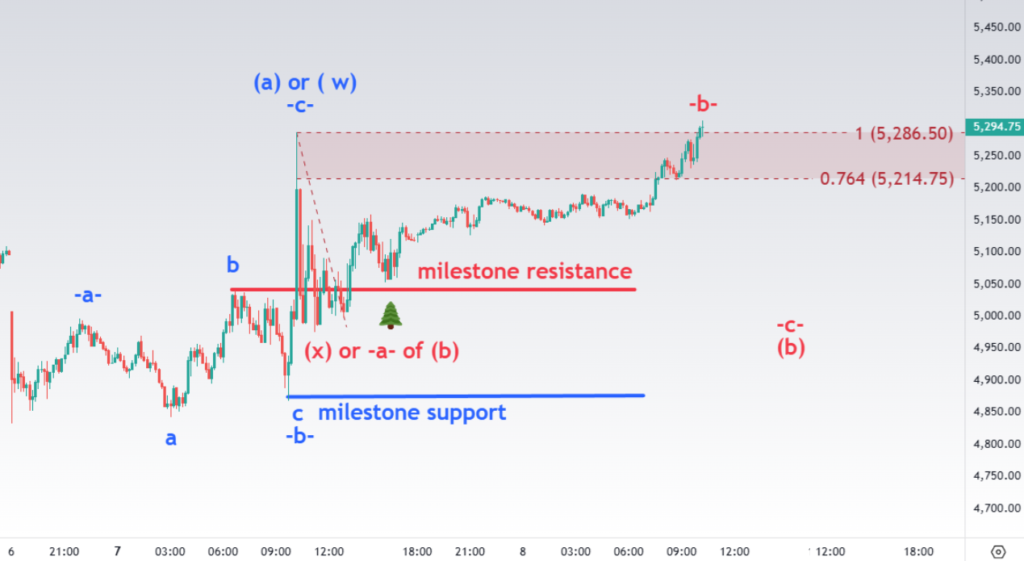
Tuesday, Apr 8 price action case study
Bottom line:
→ 5,300 – 5,292 is the battleground right now.
→ Bears need to break it decisively.
→ Bulls need to defend it aggressively.
Stay nimble. Watch reactions. Adapt accordingly.
Will add intraday updates…
MIDDAY UPDATE posted at 12:10 PM EST
ES-mini 15 min chart
Now it looks like the very bearish scenario is in play. Note 5,208 is a meaningful 41.4% retracement of the Wednesday rally. That is a normal target / support for a subwave -a- down.
We need to get a micro bounce back up to 5,292 to consider going short to ride a subwave -c- down of wave B.