$ES #ES-mini #Elliott Wave
$ES-mini keeps following the path I outlined in the update of S&P 500 index published yesterday morning.
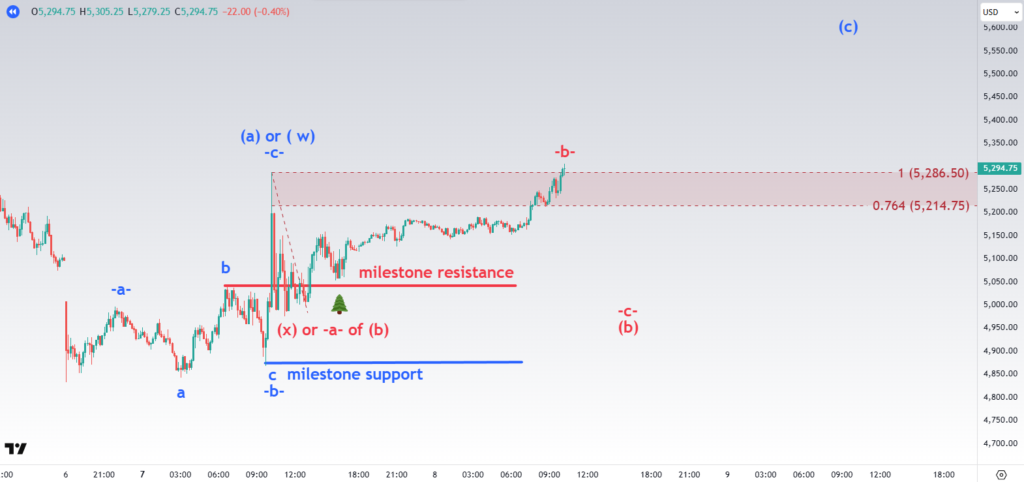
ES-mini 15 min chart
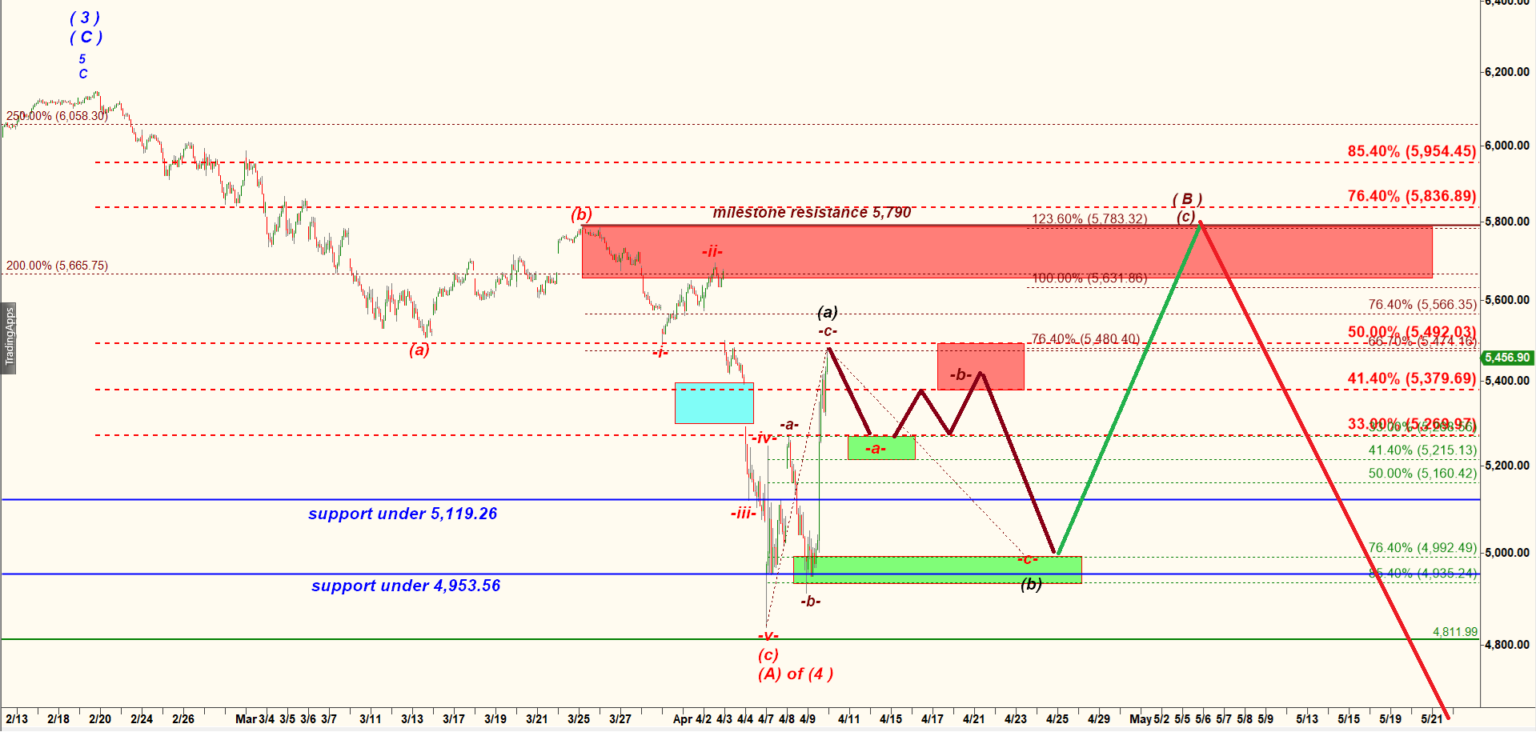
Note that I counted the a-b-c-d-e up consolidation up off the low made at 5,208.75 at 12:15 PM EST yesterday as a completed wave (b) up. hat wave count allows bears to start a new impulsive leg down in a wave (c) that may pus ES back down to the milestone support 4,871.75. To trigger that bearish scenario bears need to push ES under 5,257 (the low of the subwave d down).
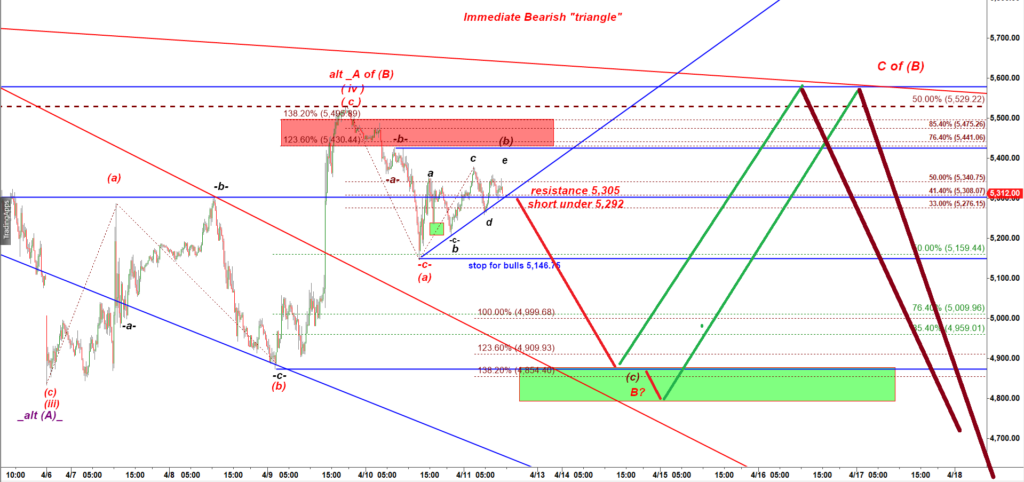
It is possible that bears would allow bulls to push that subwave-b- up higher like they did earlier this week when a very similar fractal played out:
On Monday bears tried to turn the bullish spike down and even pushed ES under the key support but then bulls stepped in and reclaimed that support (the red level on the chart below):
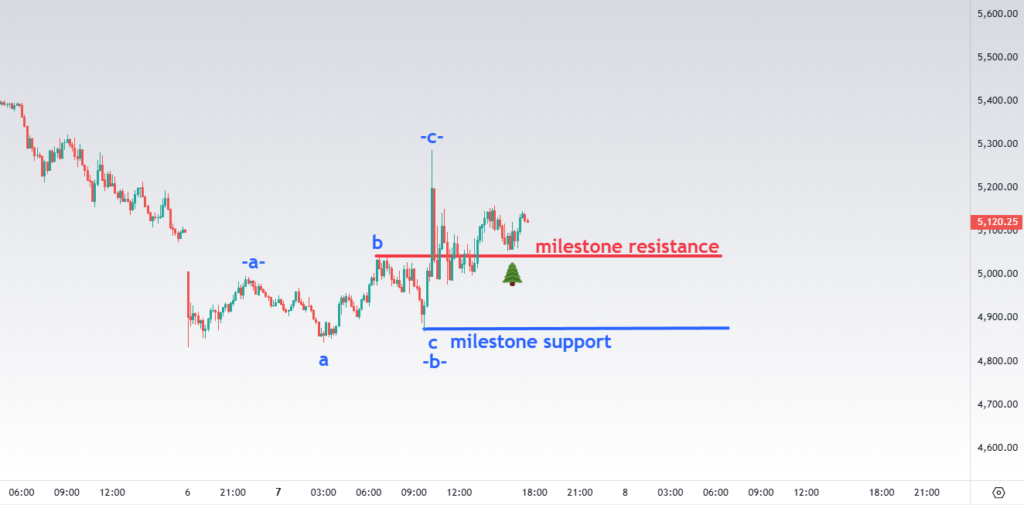
ES-mini 15 min chart, 7 April 2025
On Monday failure of bears to break the red level and start another leg down was followed by a slow grinding wave b up:
ES-mini 15 min chart, 7 April 2025
That slow grinding short squeezed even managed to slighly overshoot the previously made high:
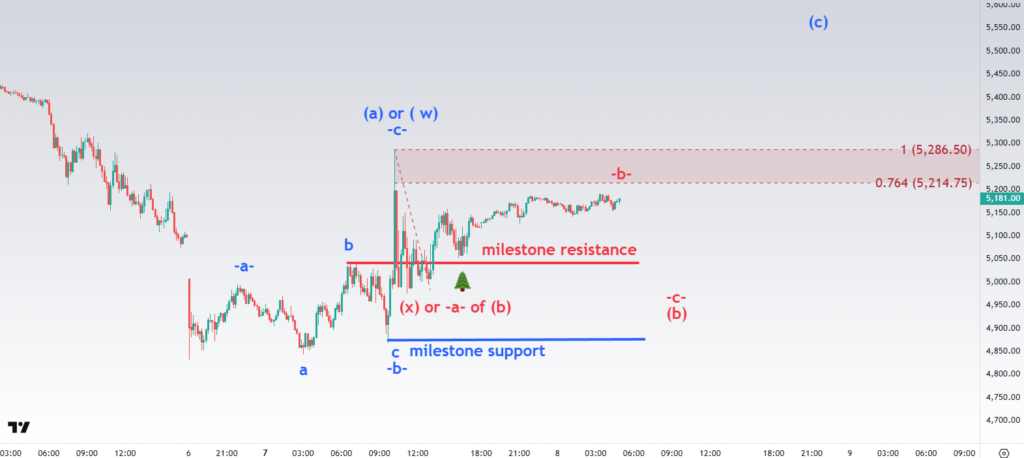
ES-mini 15 min chart posted on 7 Apr 2025
That slow grinding move was followed by a brutal drop:
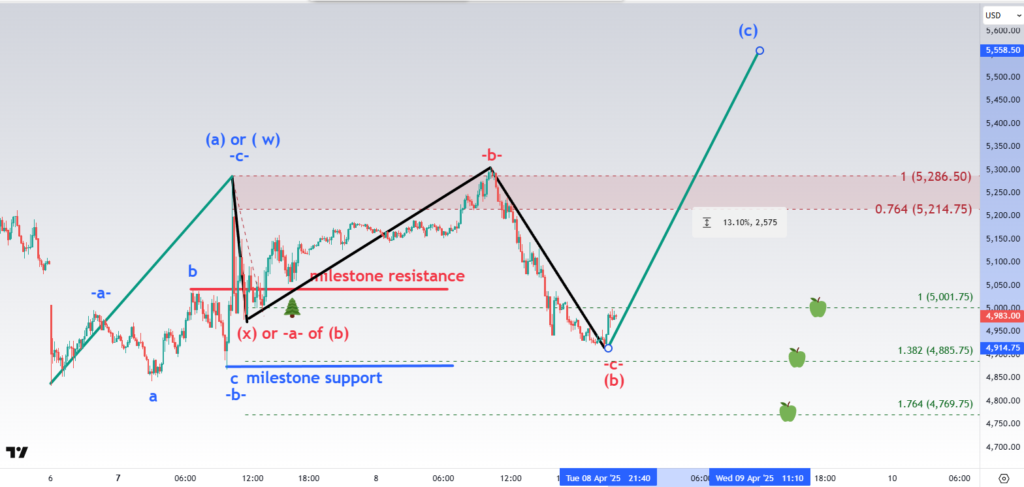
ES-mini 15 min chart posted on 7 Apr 2025
Now let’s come back to teh current ES-mini chart
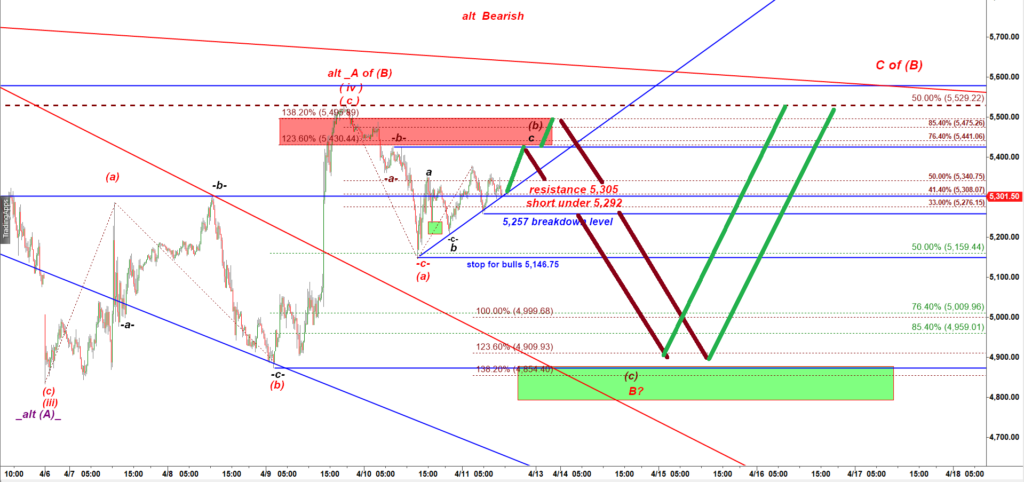
ES-min i15 min chart
So it is possible that bulls manage to hold ES over the immediate support 5,292 support this morning and avoid an immediate breakdown. But even in that case I would expect a brutal sell-off after one or two more pushes up towards the ted supply zone is made.
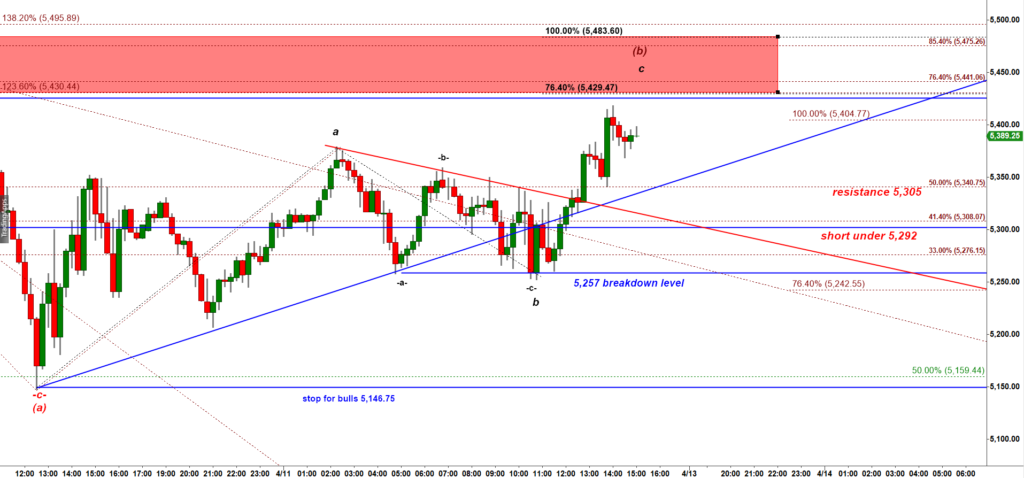
CLOSING UPDATE published t 2-54 PM EST
In my morning update I noted that bulls could manage to hold ES over 5,257 breakdown level and push ES even higher to tag the Red Supply zone.
Let’s update that chart:
ES-mini 15 min chart
This move up is a pretty normal behavior for Friday afternoon, a slow grinding move up.
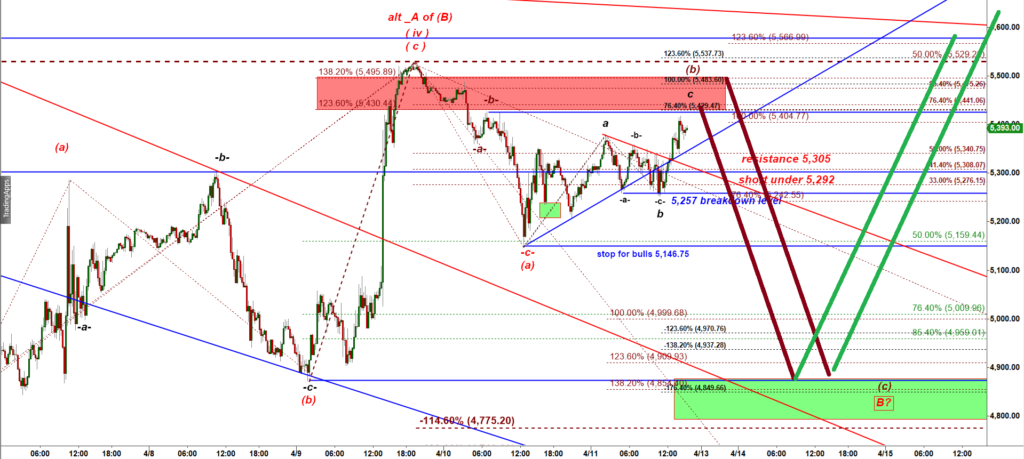
Let’s zoom-in:
ES-mini 15 min chart
So far the subwave -c- up has tagged a minimum target at 76.4% extension of the subwave -a- up = 5,429.50.
In theory bulls could push ES even higher to teh upper edge of the red supply zone = 5,483.50. Upon completion of that -a-b-c- move up I expect an impulsive (strong) drop in a wave (c) of B down.